[https://www.geogebra.org/m/tbxs3jxg](https://www.geogebra.org/m/tbxs3jxg)
![[Pasted image 20250405142153.png]]

[Open: flat_seasons.gif](https://publish.obsidian.md/shanesql/Attachments/flat_seasons.gif)

[Open: capped_cube_seasons (1).gif](https://publish.obsidian.md/shanesql/Attachments/capped_cube_seasons++1+.gif)
## Cylindrical Cartesian Coordinate System
Translations
- lat/lon coordinates are invariant between flat earth and globe earth.
- All formulas that work on lat/lon coordinates will work on both models. Haversine for example will produce correct distances on a flat earth model.
- There exists a transformation from cartesian to lat/lon coordinates and so all physics formulas can be converted into shape-agnostic ones.
- Extending this to 3 dimension (lat, lon, distance), will complete this work.
### Azimuthal coordinate transformation onto a cylinder
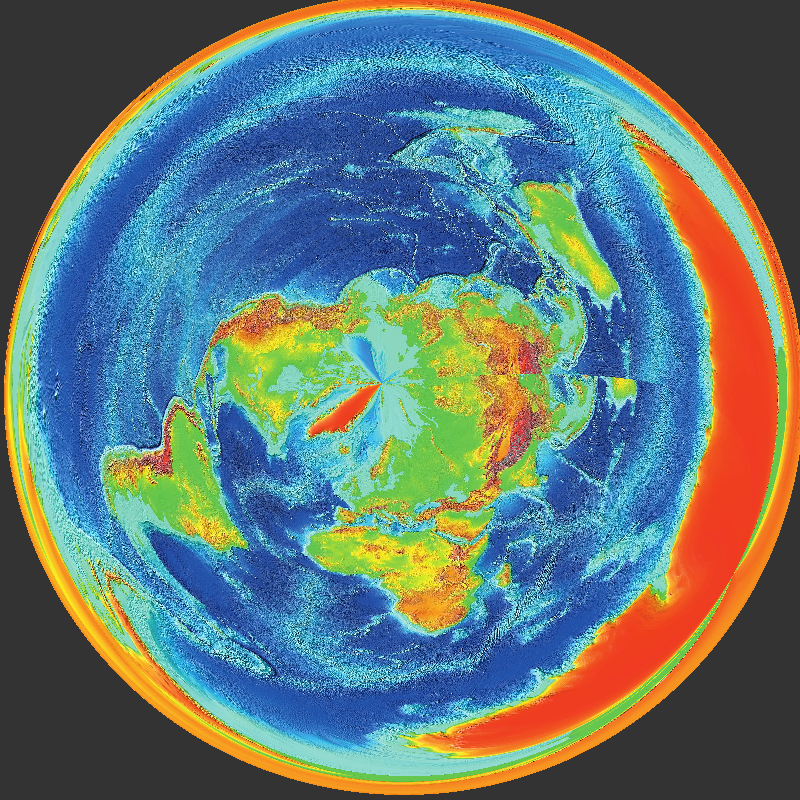
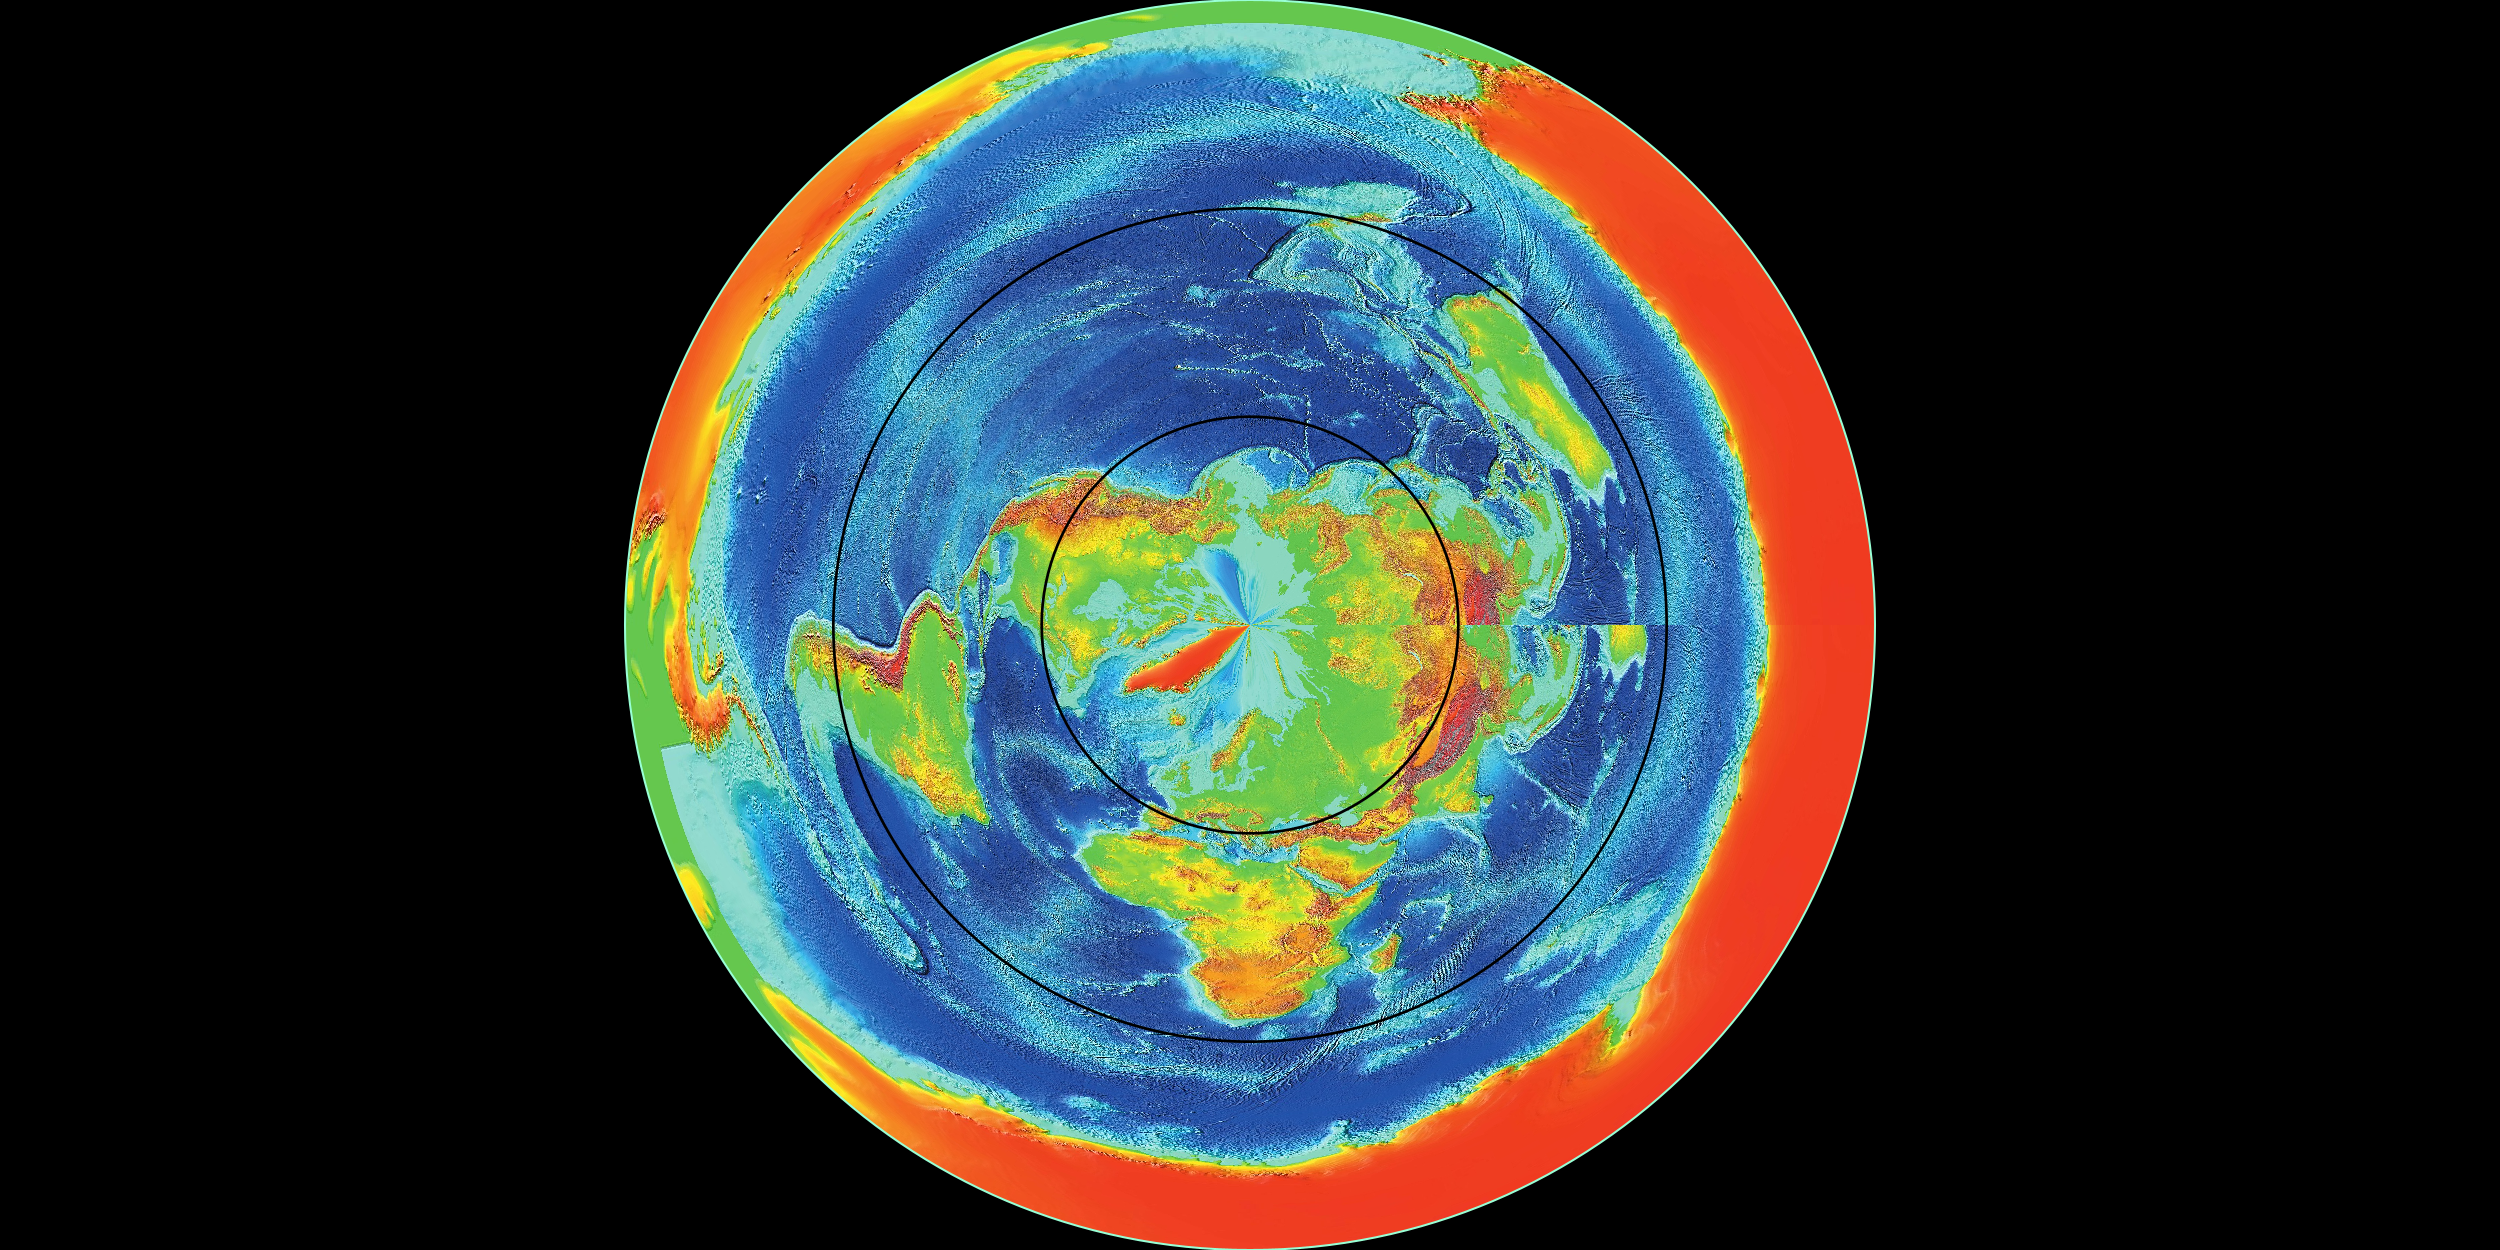
Intuition: Fill space with concentric sphere’s around the origin. For every sphere , transform it into a disc with an an azimuthal equidistant projection and finally insert the disc into a cylinder at a height equal to the radius of the sphere.
Azimuthal transformation is a coordinate transformation that converts cartesian space into a cylinder. The transformation is lossless and reversible (ie it’s a transformation, not a projection). Within the resulting cylinder, any shell around the origin will become a flat disc (an azimuthal projection of that sphere).
[Open: Pasted image 20240509165838.png](https://publish.obsidian.md/shanesql/Attachments/Pasted+image+20240509165838.jpeg)
[Open: Pasted image 20240509165838.jpeg](https://publish.obsidian.md/shanesql/Attachments/Pasted+image+20240509165838.jpeg)
[Open: Pasted image 20240509202715.png](https://publish.obsidian.md/shanesql/Attachments/Pasted+image+20240509202715.jpeg)
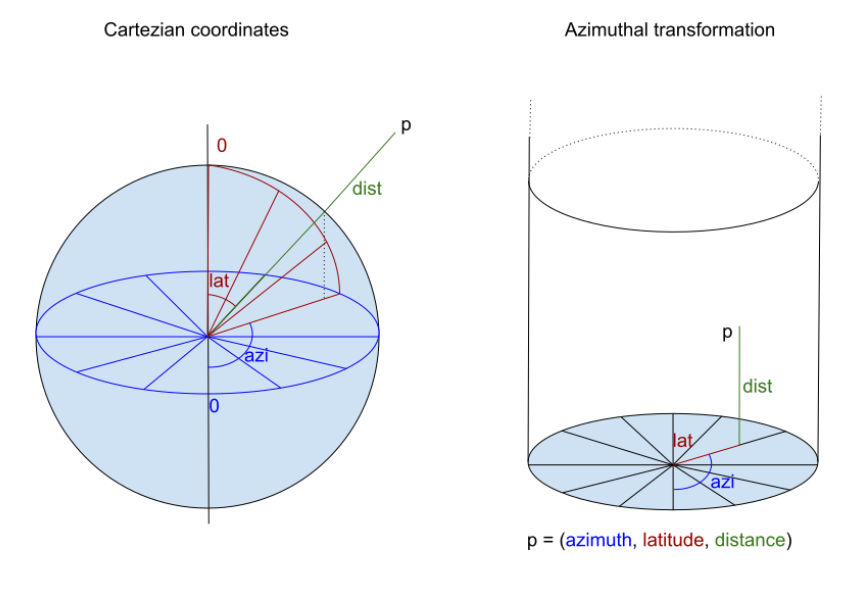
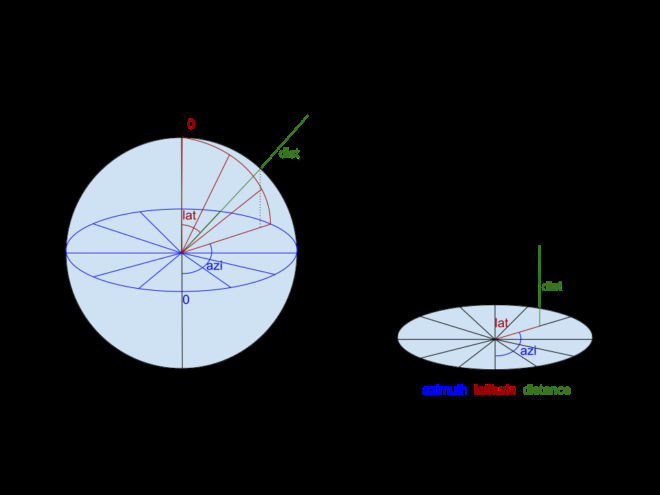
Definition: any point in cartesian space (x, y, z) can be represented with celestial coordinates (_azimuth, altitude, distance_) relative to an origin. All points on a sphere around this origin with radius _d_ will have the same _distance_ in celestial coordinates, ie all their coordinates will look like (azimuth, altitude, _d_). Ie a flat 2D structure at height _d_. (_azimuth, altitude_) can be drawn like a AE projection map: azimuth as an angle around the center, altitude as a distance from said center. And by doing so, 3D space will be transformed into an infinitely high cylinder.
[Open: Pasted image 20240509165936.png](https://publish.obsidian.md/shanesql/Attachments/Pasted+image+20240509165936.png)
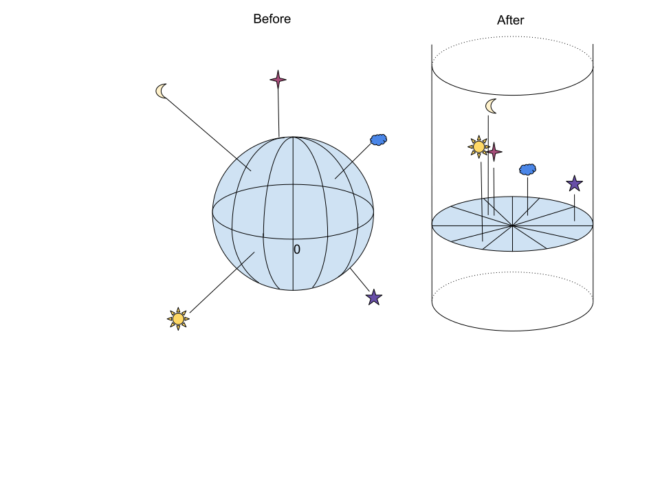
### Azimuthal transformation with the earth as origin
When performing an azimuthal transformation with the center of the earth as origin, it will transform all of space into an infinitely high cylinder. In this cylinder, at height 0 will be the center of the earth. Around 6371km will be an azimuthal projection of earth (a flat earth). Above the disc earth, will be all celestial objects at their cartesian distance from the center of the earth.
### Physics in the azimuthal cylinder
Azimuthal transformation is lossless and reversible. It is a coordinate transformation not a projection: it’s just like polar coordinates and cartesian ones: they represent the same thing in a different way and you can easily switch back and forth between them.
Physics in this cylinder work exactly the same and equally expressive as in the cartesian plane. Anything that can be proven in cartesian space, can also be proven in an azimuthal transformed cylinder by at most 2 extra coordinate transformations
Proof_in_azimuthal(claim) = convert_to_azimuthal(prove_in_cartesian(convert_to_cartestian(claim)))
Azimuthal transformation preserves some properties but breaks several others:
- Coordinates in azimuthal space are numerically identical to celestial coordinates. Latitude and longitude on the disc are still the same after transformation
- Spheres and shells about the origin become circles and discs
- azimuth and distance are preserved, altitude is “broken”
- Angles and distances involving altitude need special formulas
[Open: horizon_cone.gif](https://publish.obsidian.md/shanesql/Attachments/horizon_cone.gif)
### Can you explain day/night/seasons/eclipses/…?
Once we realize travels in curves, and that one cannot see below/outside the horizon, all of optics suddenly makes sense. When the sun moves inside the horizon-cone it will be day, when it moves outside, it’s night. By having the sun change altitude, it will change positions and explain why there are longer days in summer than winter.
ay/night and seasons on a flat earth
[Open: flat_seasons (2).gif](https://publish.obsidian.md/shanesql/Attachments/flat_seasons++2+.gif)
Azimuthal transformation preserves some properties but breaks several others:
- Coordinates in azimuthal space are numerically identical to celestial coordinates. Latitude and longitude on the disc are still the same after transformation
- Spheres and shells about the origin become circles and discs
- azimuth and distance are preserved, altitude is “broken”
- Angles and distances involving altitude need special formulas
# ##Distances
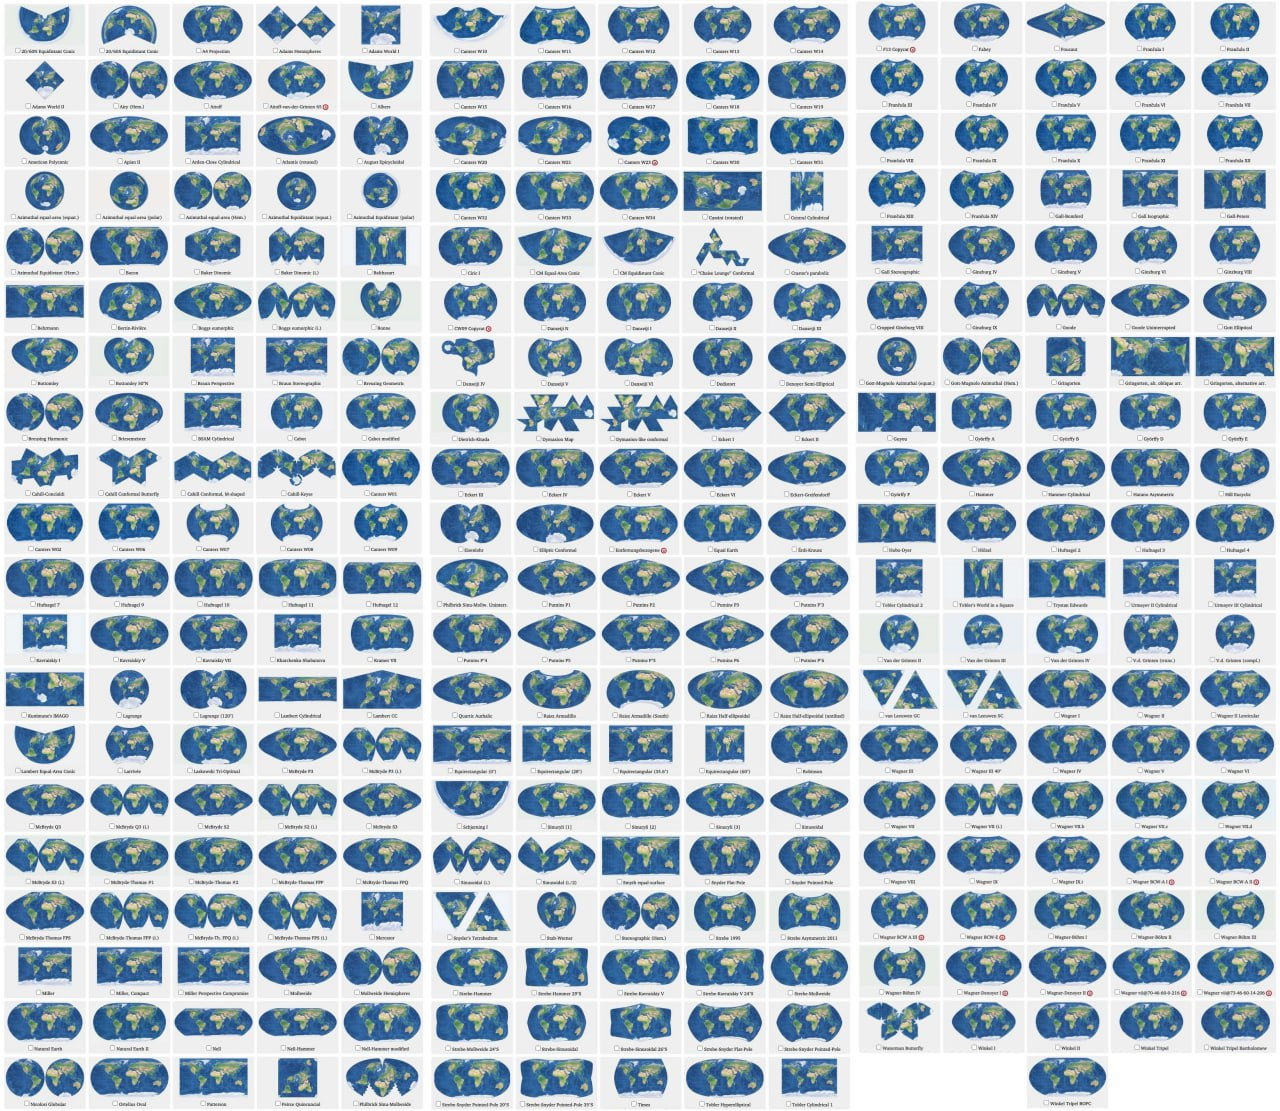
What do all worldwide maps project?
The correct answer is....
COORDINATE SYSTEMS!
NOT THE GLOBE. 😅🙏
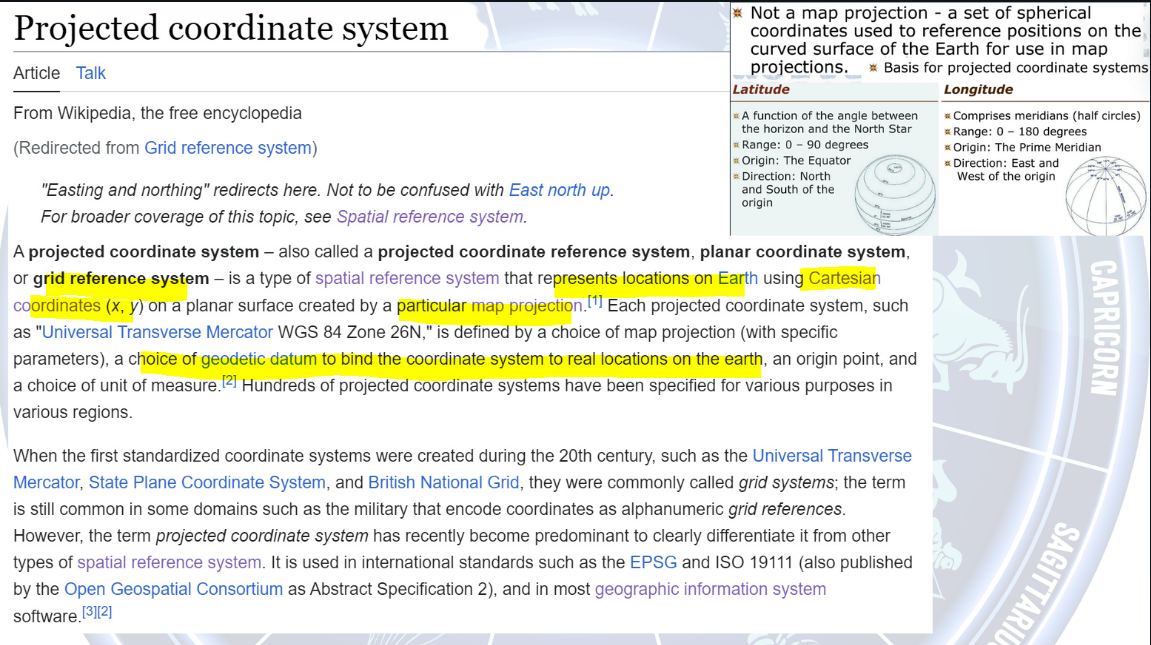
However, the only projected coordinate system anyone is familiar with is the geographic graticule. This is the gridded, spherical, network of longitude and latitude. This coordinate system is ENTIRELY BASED ON ANGLES TO THE STARS.
This means it also, is inherently spherical. If you think of the horizon line as a great bisecting great meridian, it is the basis from which you take angles to the stars. Because you observe the sky in a hemisphere, (no way around this on either model) the coordinate system in which you observe polaris or the sun at a specific latitude, is of course tied to the stars.
On the wiki page, it specifies coordinate systems MUST be tied to a DATUM for it to maintain any real-world significance. This is true. This is why all maps are tied to GEODETIC datums such as WGS84, WGS83, NAD27, and NAD83. All of these are SPHERICAL.
In the old days, it was called Cosmography, because of the very real link between the stars, maps, and the land. For EVERY SINGLE POINT on earth, there is an equivalent and unique point in the sky. And for every point in the sky, there is a unique position on the ground depending on the time. This is the only way Celestial navigation could work. This is the basis of determining distances on earth, according to the stars.
We have distances determined from basic trig and an angle to a star, which gives us a GP (ground position), the place where that star would be at the zenith of an observer.
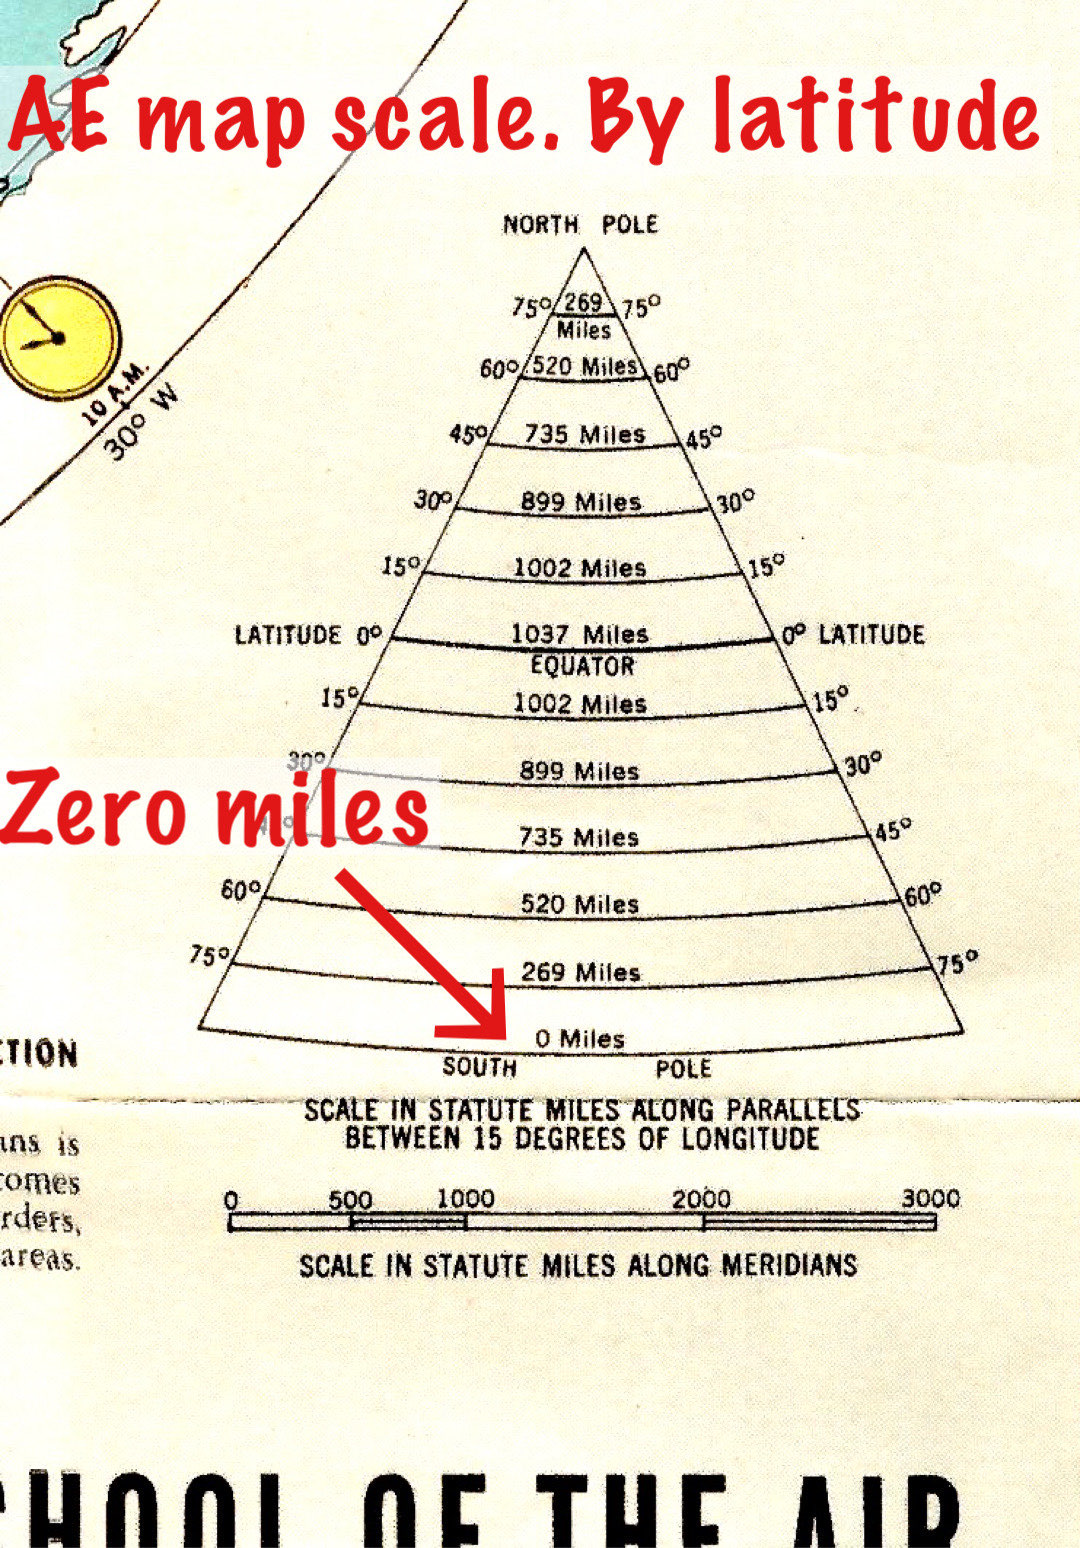
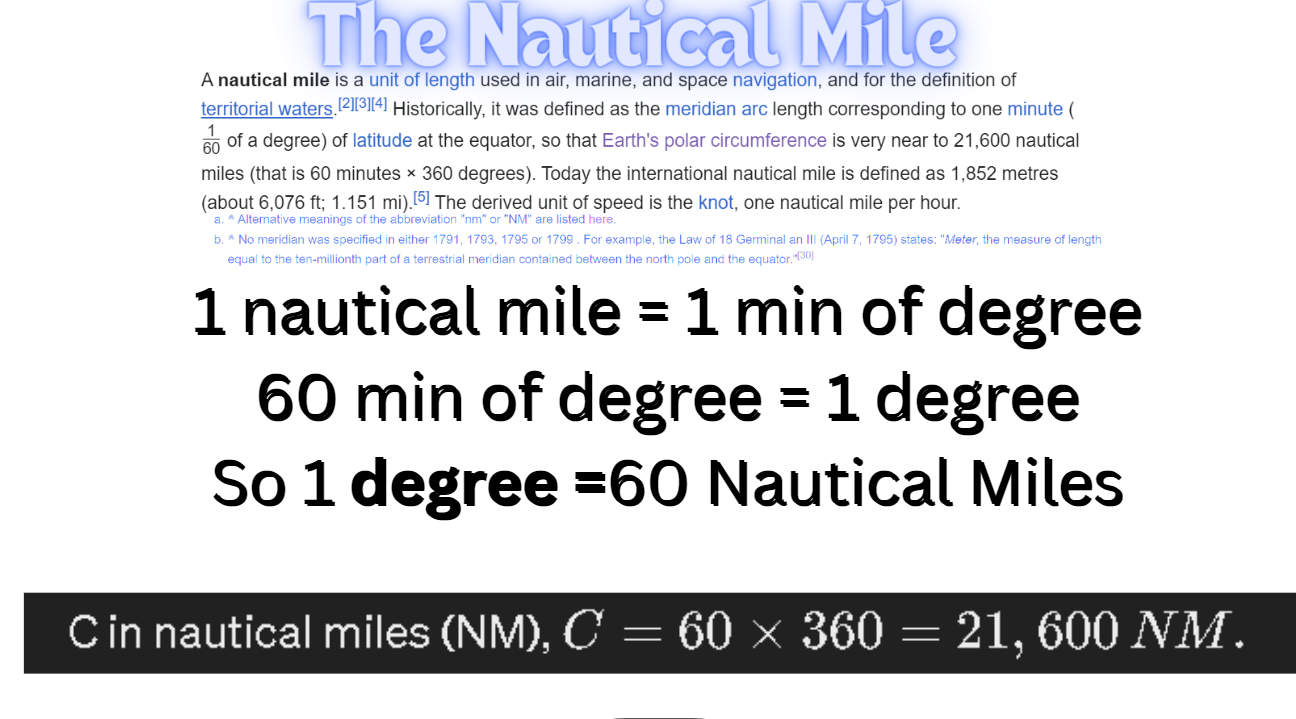
Therefore, all distances based on these coordinate systems must translate without a remainder. This is called a covariant transformation and is prevalent in relativity. The way this is accomplished is through the Nautical mile. Historically, this was simply a unit of a circle.
1 nautical mile = 1 min of degree
60 min of degree = 1 degree
So 1 degree =60 Nautical Miles
The power of nautical miles is that the distance is invariant between coordinate systems. The distances like those measured in nautical miles remain consistent.
This is because the formulas that calculate distances based on angles to the stars (like the Haversine formula) remain valid regardless of the underlying shape assumption of the Earth.
This means that for navigation and mapping, using either a flat or spherical model does not impact the practical outcomes when using properly adjusted coordinate transformations. Measurements like nautical and statute miles retain their values and utility PRECISELY because their definition ties back to the coordinate system (latitude and longitude), which remains invariant between transformations.
To summarize, distances on the celestial sphere and on the geographic graticule are identical. They both represent geodesic distances between points on a sphere. This is why so many people are still confused and think we live on a sphere!
The shape of the earth is never actually considered when comparing distances calculated in spherical coordinate systems.
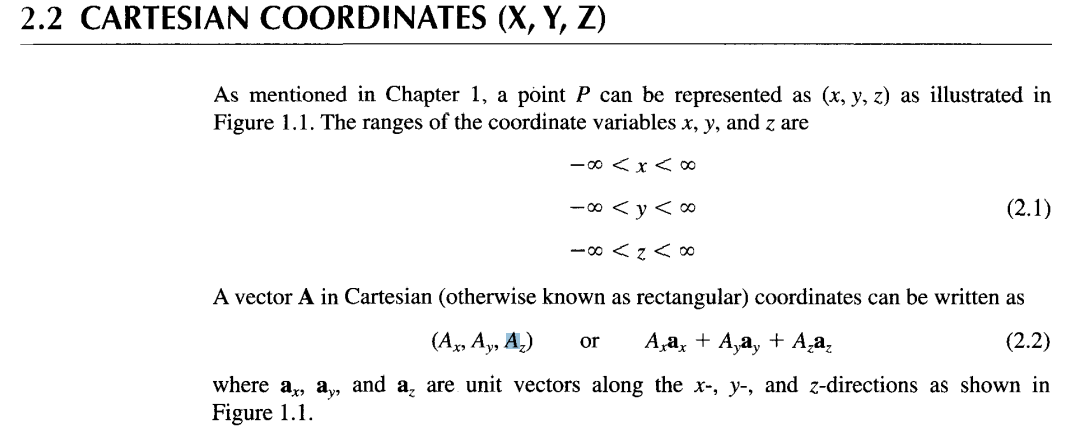
## Cartesian Coordinates (X, Y, Z)
a point P can be represented as (x, y, z) as illustrated in Figure 1.1. The ranges of the coordinate variables x, y, and z are -00 < X < 00 -00<-y (2.1) — 00 < I < 00 A vector A in Cartesian (otherwise known as rectangular) coordinates can be written as (Ax,Ay,AJ or A A + Ayay + Azaz (2.2) where ax, ay, and az are unit vectors along the x-, y-, and z-directions
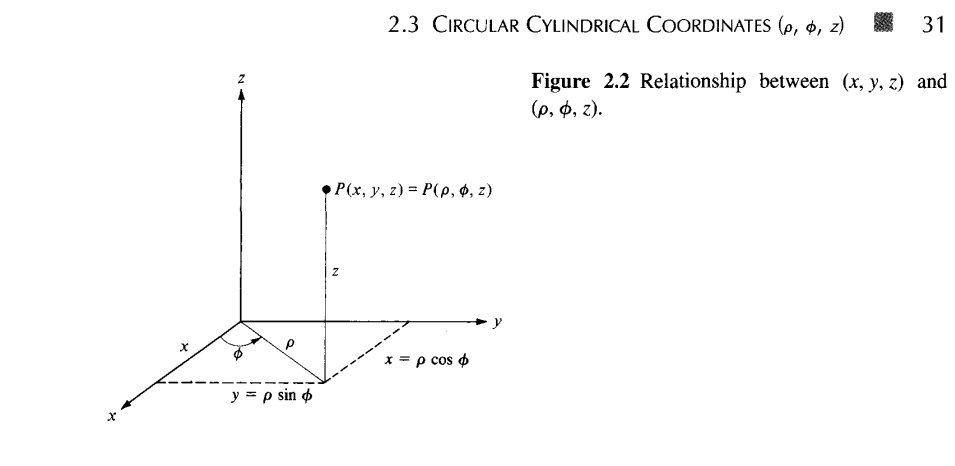
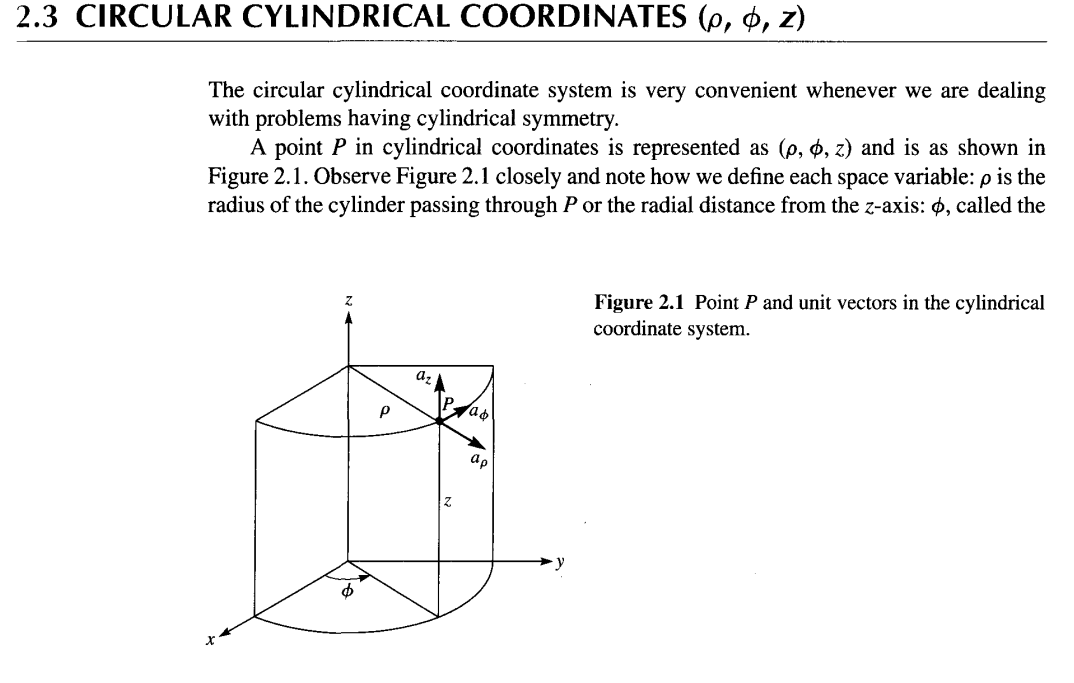
## Circular Cylindrical Coordinates (p, 0, z)
The circular cylindrical coordinate system is very convenient whenever we are dealing with problems having cylindrical symmetry. A point P in cylindrical coordinates is represented as (p, , z) and is as shown in Figure 2.1. Observe Figure 2.1 closely and note how we define each space variable: p is the radius of the cylinder passing through P or the radial distance from the z-axis: , called the Figure 2.1 Point P and unit vectors in the cylindrical coordinate system. 30 Coordinate Systems and Transformation azimuthal angle, is measured from the x-axis in the xy-plane; and z is the same as in the Cartesian system.
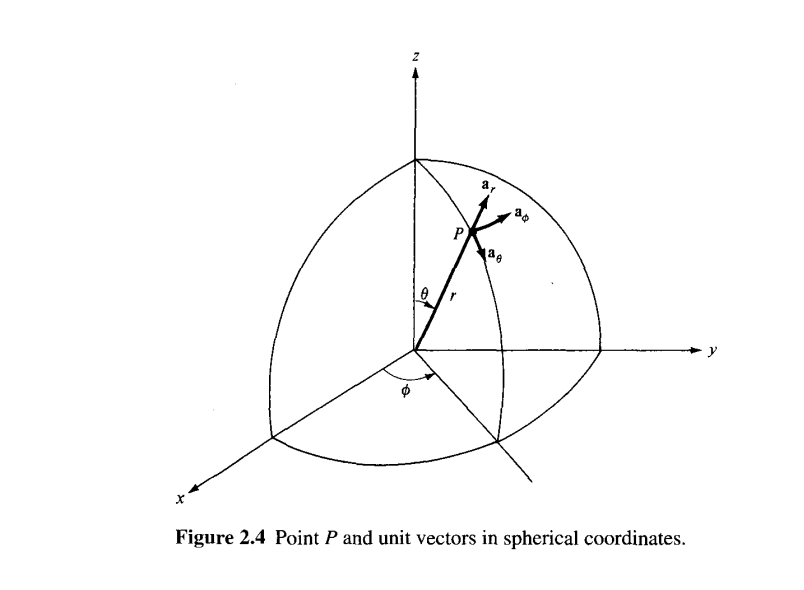
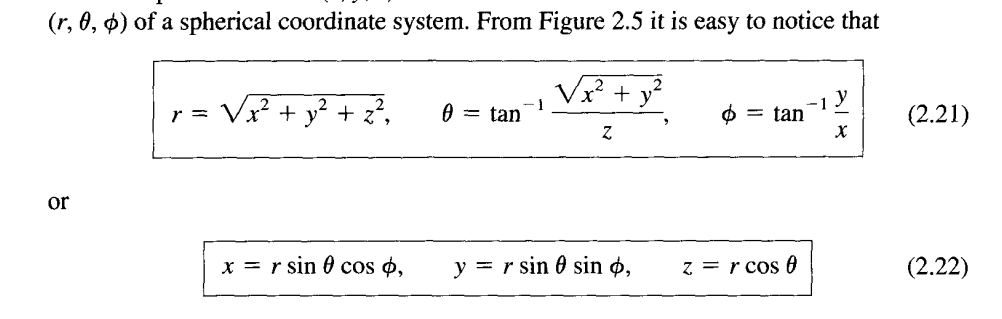
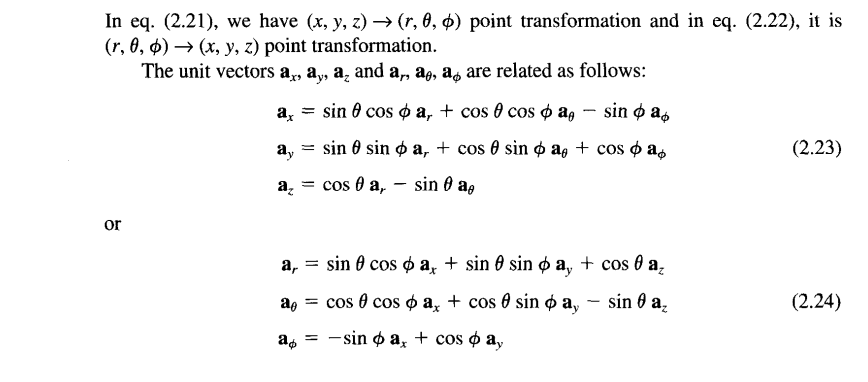
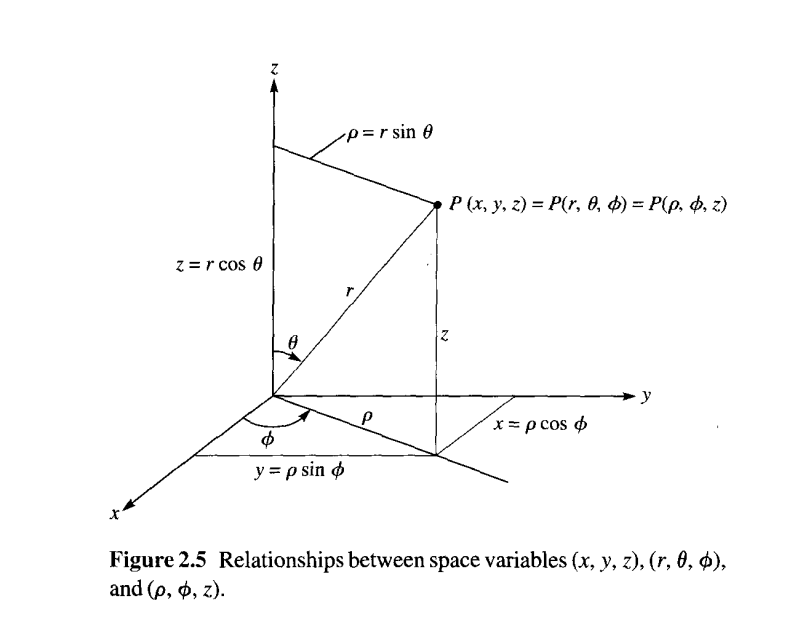
## Spherical Coordinates (p, 0, z)
The spherical coordinate system is most appropriate when dealing with problems having a degree of spherical symmetry. A point P can be represented as (r, 6, 4>) and is illustrated in Figure 2.4. From Figure 2.4, we notice that r is defined as the distance from the origin to 2.4 SPHERICAL COORDINATES (r, e, 33 point P or the radius of a sphere centered at the origin and passing through P; 6 (called the colatitude) is the angle between the z-axis and the position vector of P; and 4> is measured from the x-axis (the same azimuthal angle in cylindrical coordinates).
# Maps have been lying to you all your life
[https://www.youtube.com/watch?v=m2sgWUNWKqE&ab_channel=23ABCNews%7CKERO](https://www.youtube.com/watch?v=m2sgWUNWKqE&ab_channel=23ABCNews%7CKERO)
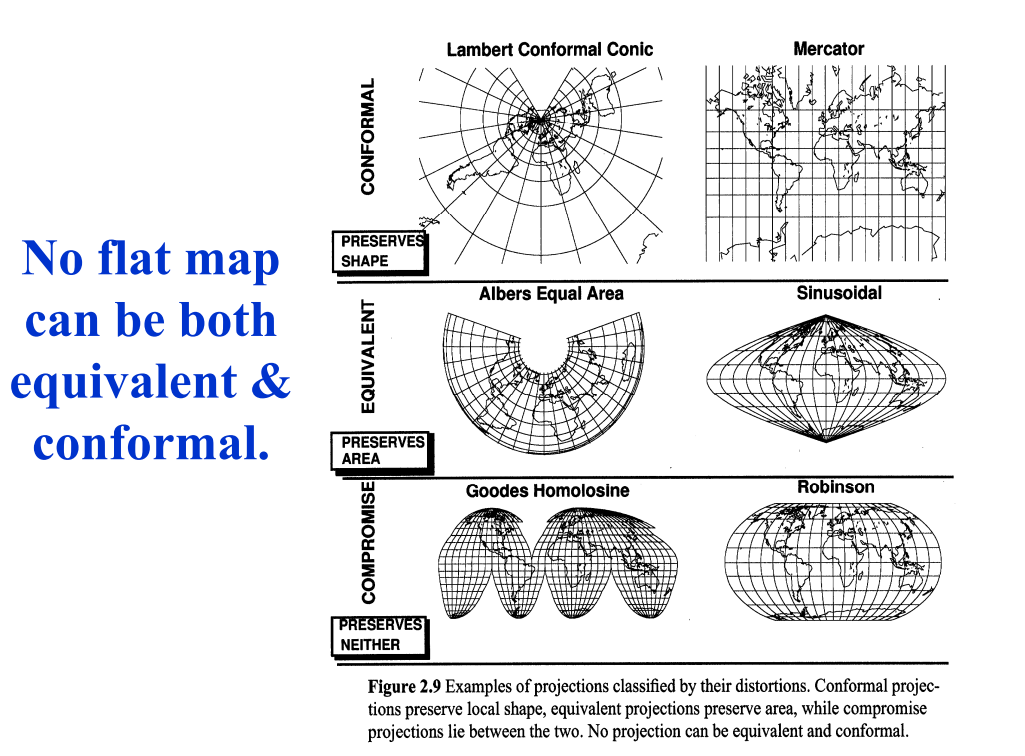
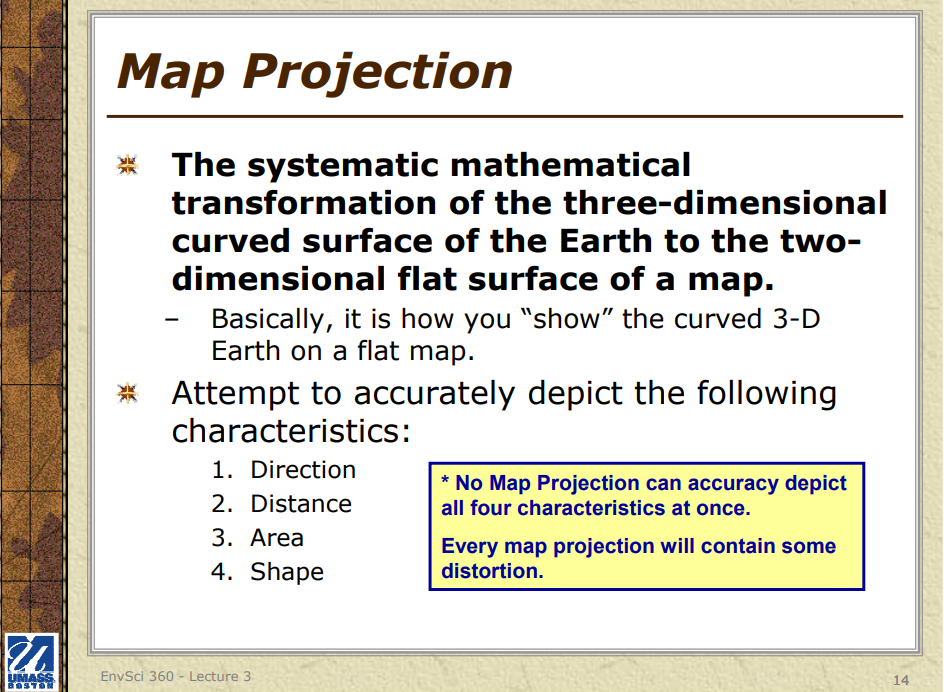
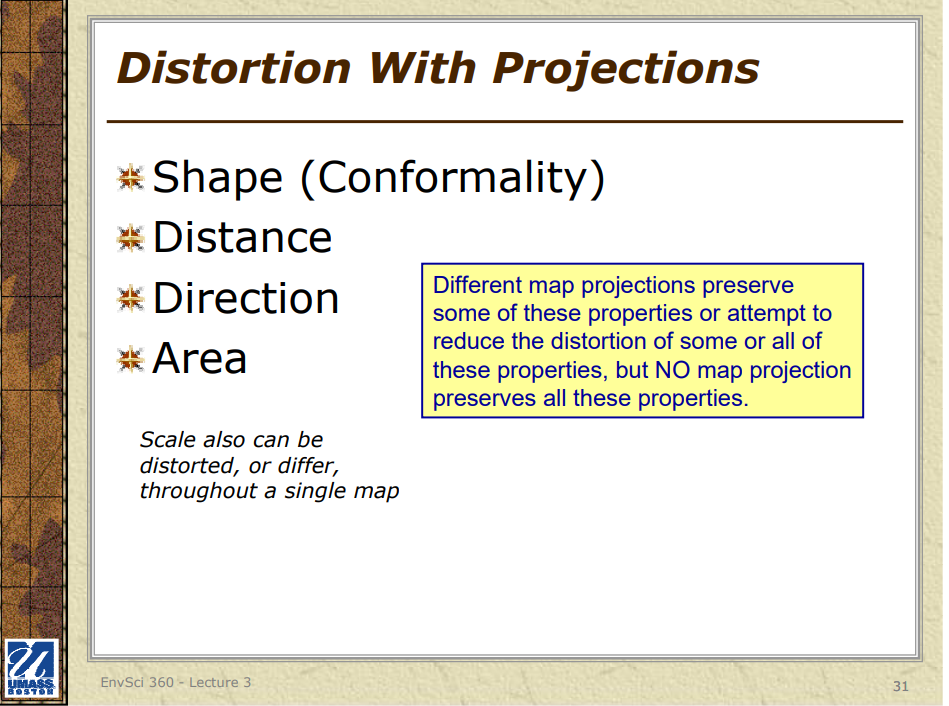
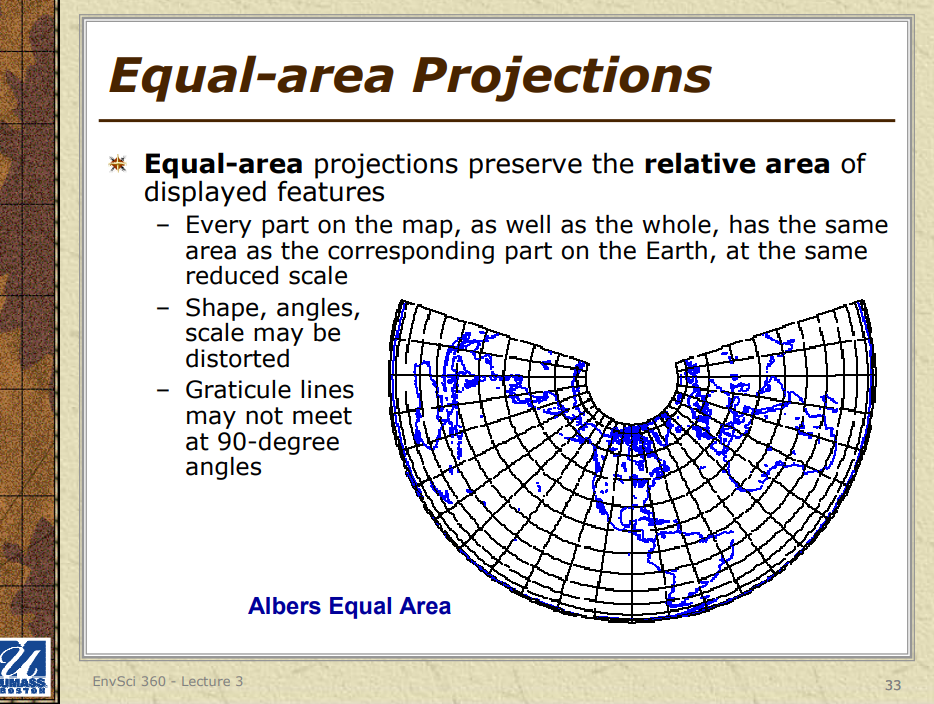
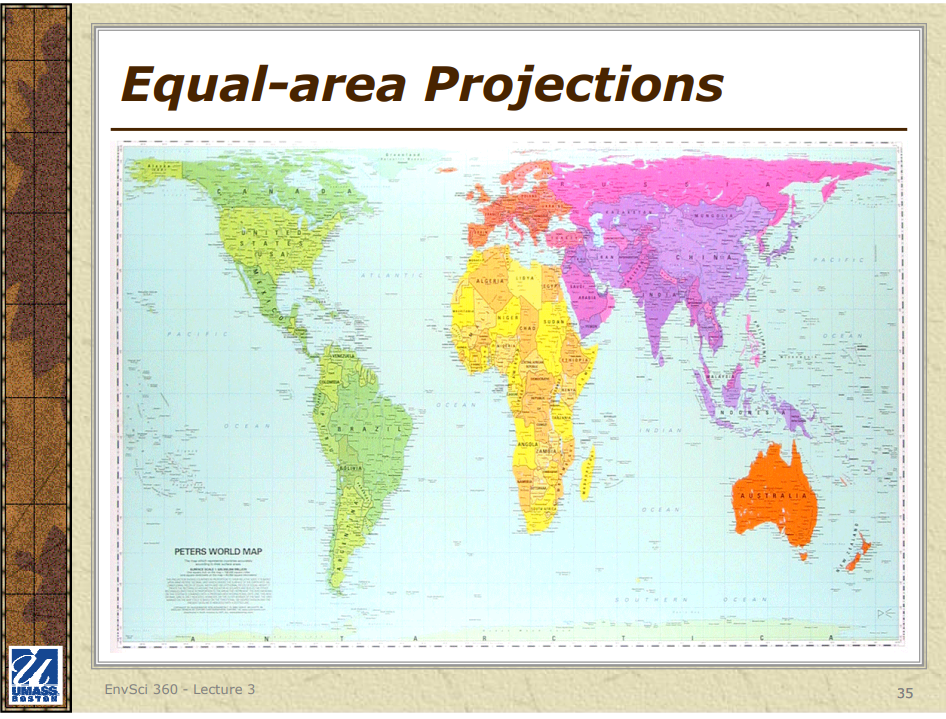
1. Area-preserving projection – Also called equal area or equivalent projection, these projections maintain the relative size of different regions on the map.
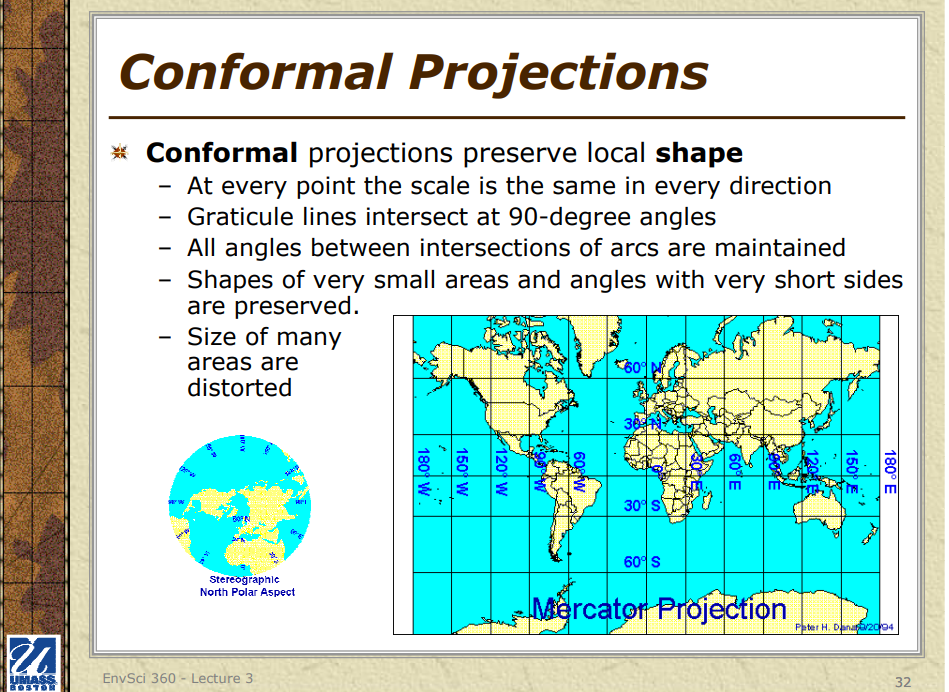
2. Shape-preserving projection – Often referred to as conformal or orthomorphic, these projections maintain accurate shapes of regions and local angles.
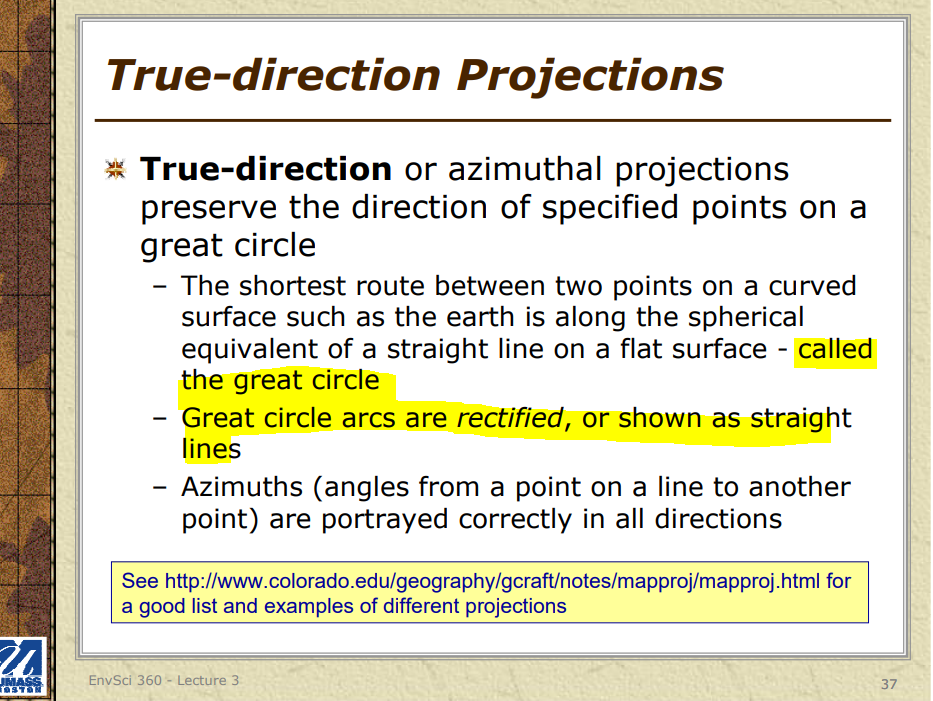
3. Direction-preserving projection – This category includes conformal, orthomorphic, and azimuthal projections, which preserve directions, but only from the central point for azimuthal projections.
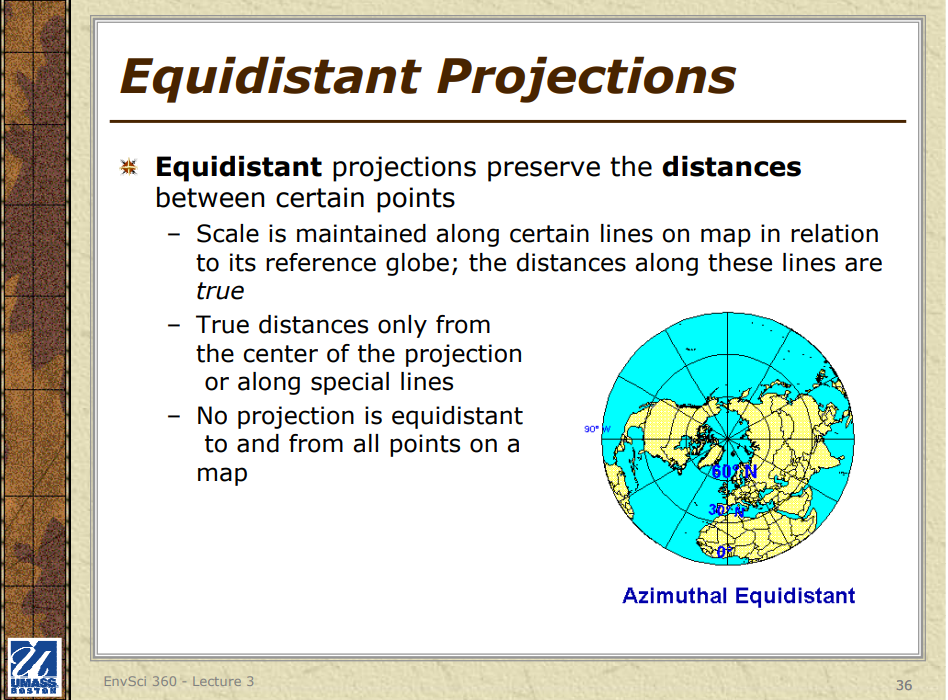
4. Distance-preserving projection – Known as equidistant projections, they display the true distance between one or two points and all other points on the map.
How do Map Projections Work?
[https://www.youtube.com/watch?v=NAzy4S4EOwc&ab_channel=GeneralKnowledge](https://www.youtube.com/watch?v=NAzy4S4EOwc&ab_channel=GeneralKnowledge)
## Early Maps and the Global Coordinate System
[https://commons.wikimedia.org/wiki/Category:1700s_maps_of_the_world](https://commons.wikimedia.org/wiki/Category:1700s_maps_of_the_world)
Maps
Coordinate Systems
Latitude
The Issue of Longitude
Maps and Cartography
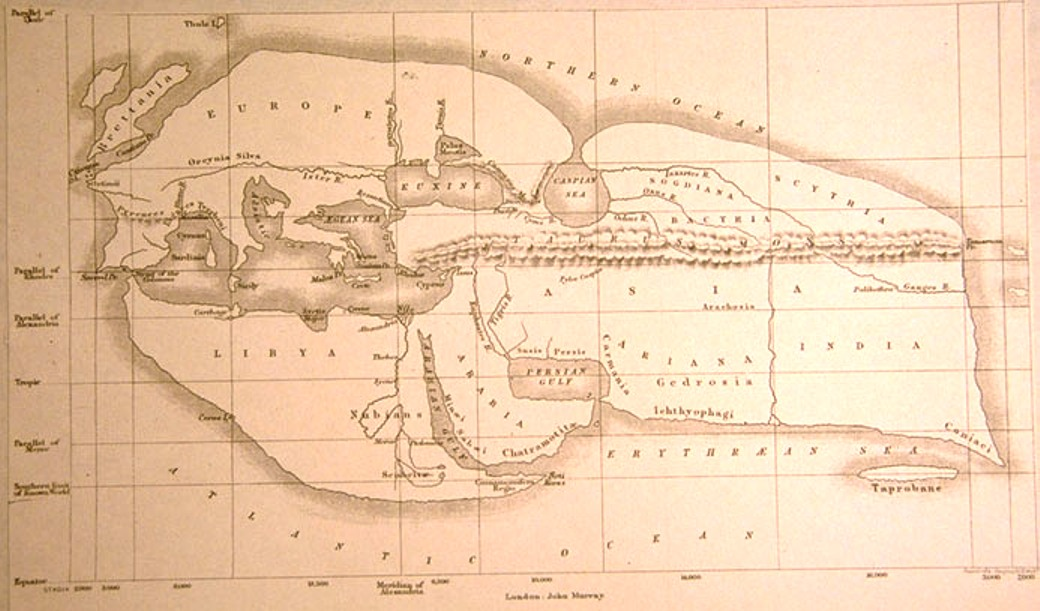
do you believe this map, all because you believe Eratosthenes stick and shadow experiment? As this was his map he made and someone just drew it in modern times.
[https://digitalmapsoftheancientworld.com/ancient-maps/eratosthenes-map/](https://digitalmapsoftheancientworld.com/ancient-maps/eratosthenes-map/)
Some of the earliest known maps date back to 16,500 BCE and show the night sky rather than the Earth. Ancient cave paintings and rock carvings also depict landscape features like hills and mountains. Archaeologists believe that these paintings were used both to navigate the areas they showed and to portray the areas that people visited.
Maps were created in ancient Babylonia (mostly on clay tablets), and it is believed that they were drawn with very accurate surveying techniques. These maps showed topographical features like hills and valleys but also had labeled features. The Babylonian World Map, created in 600 BCE, is considered to be the earliest map of the world. It is unique because it is a symbolic representation of the Earth.
Cartography is defined as the science and art of making maps or graphical representations showing spatial concepts at various scales. Maps convey geographic information about a place and can be useful in understanding topography, weather, and culture, depending upon the type of map.
Early forms of cartography were practiced on clay tablets and cave walls. Today, maps can show a plethora of information. Technology such as Geographic Information Systems (GIS) allows maps to be made relatively easily with computers.
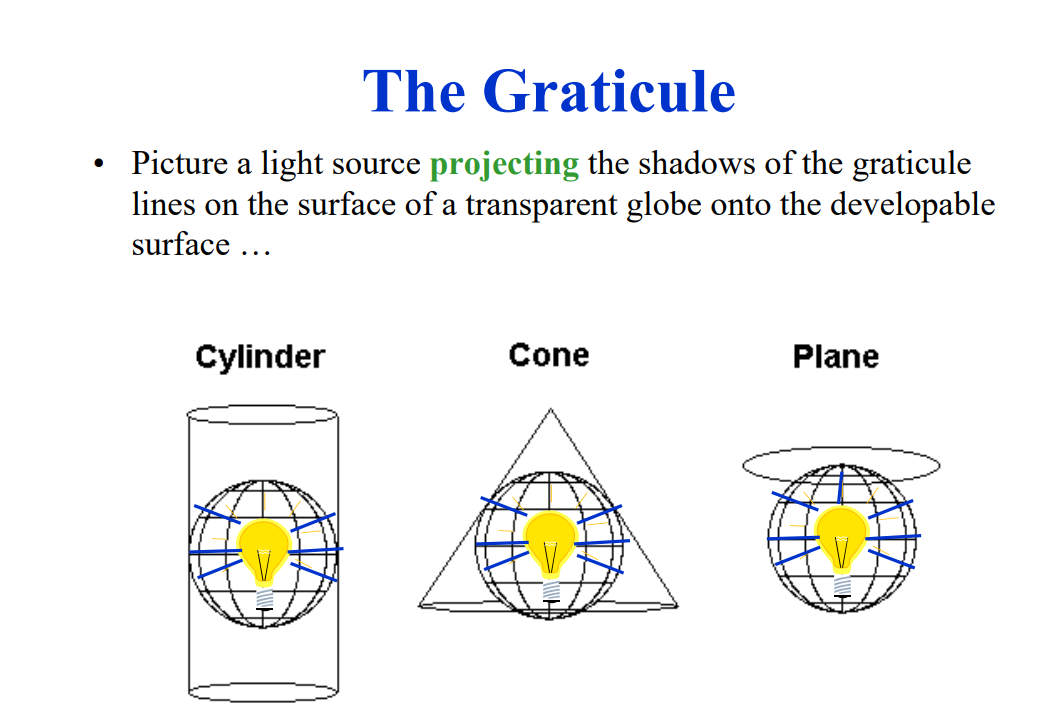
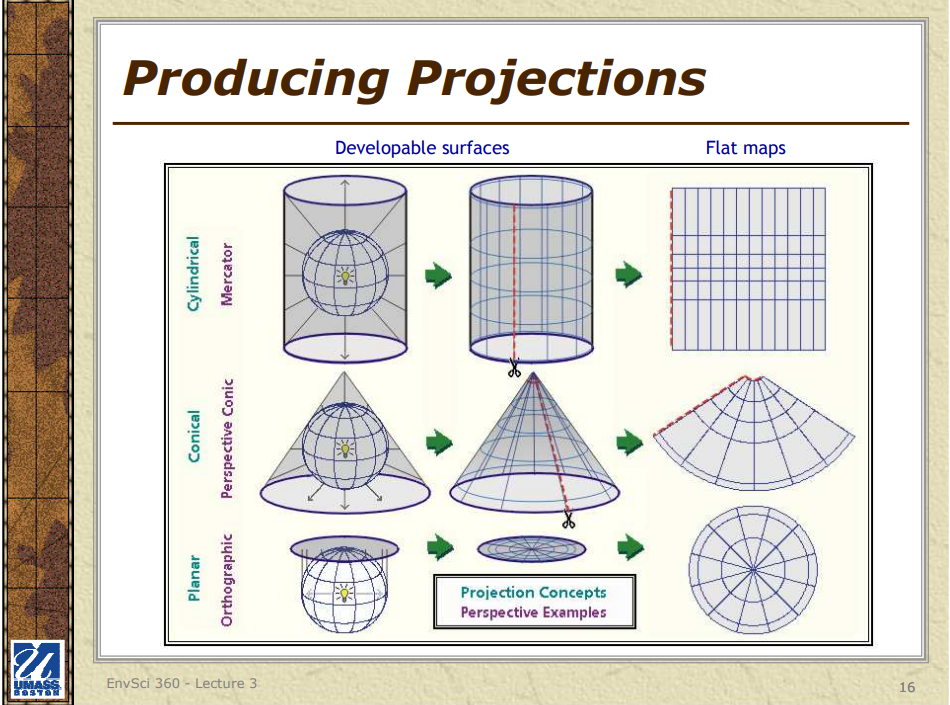
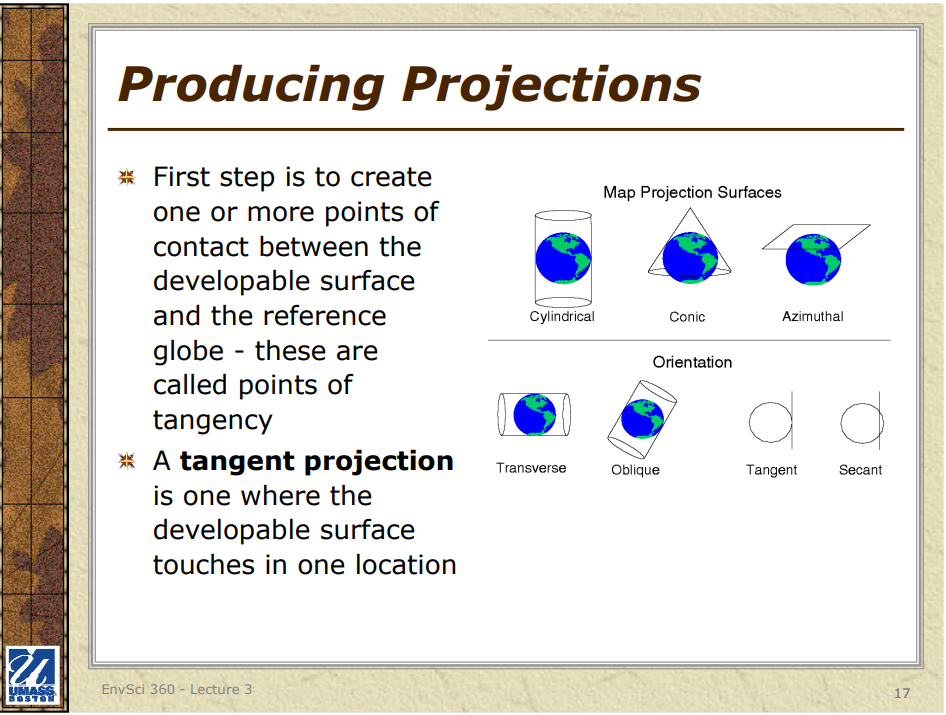
## HOW MAP PROJECTIONS ARE CATEGORIZED
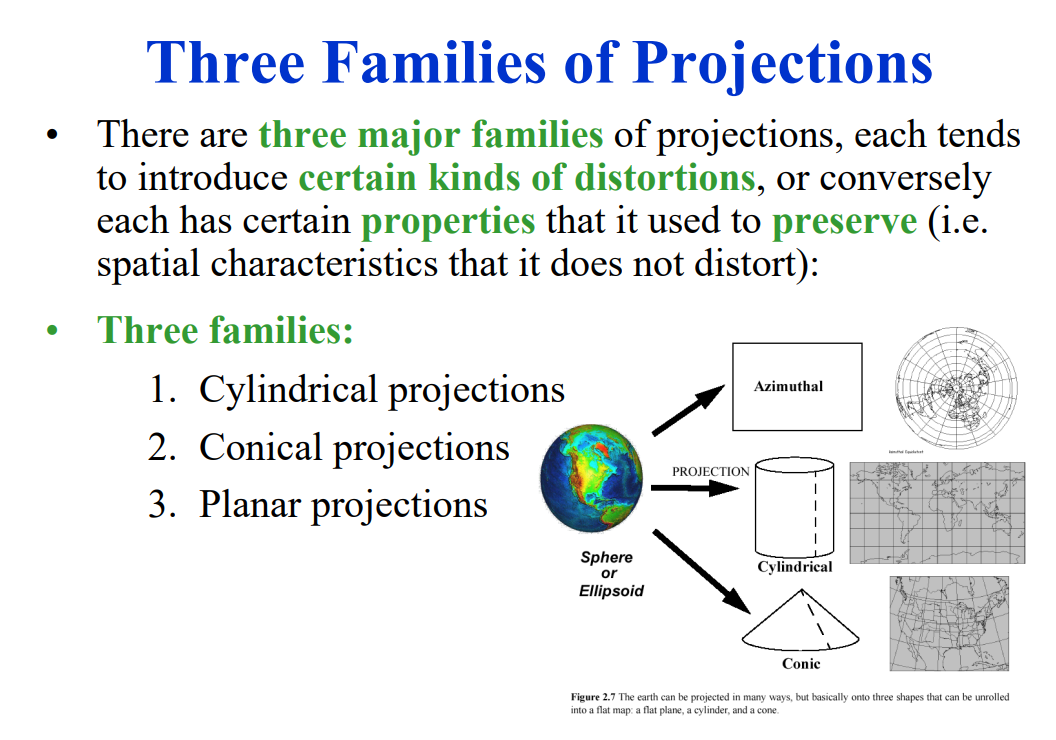
The primary categories of map projections include:
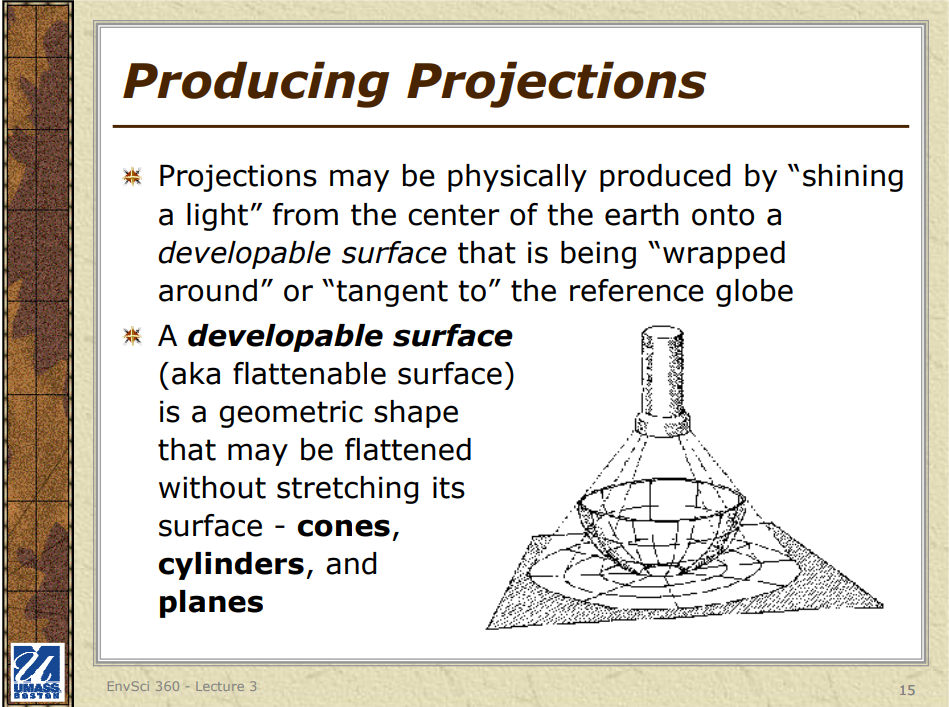
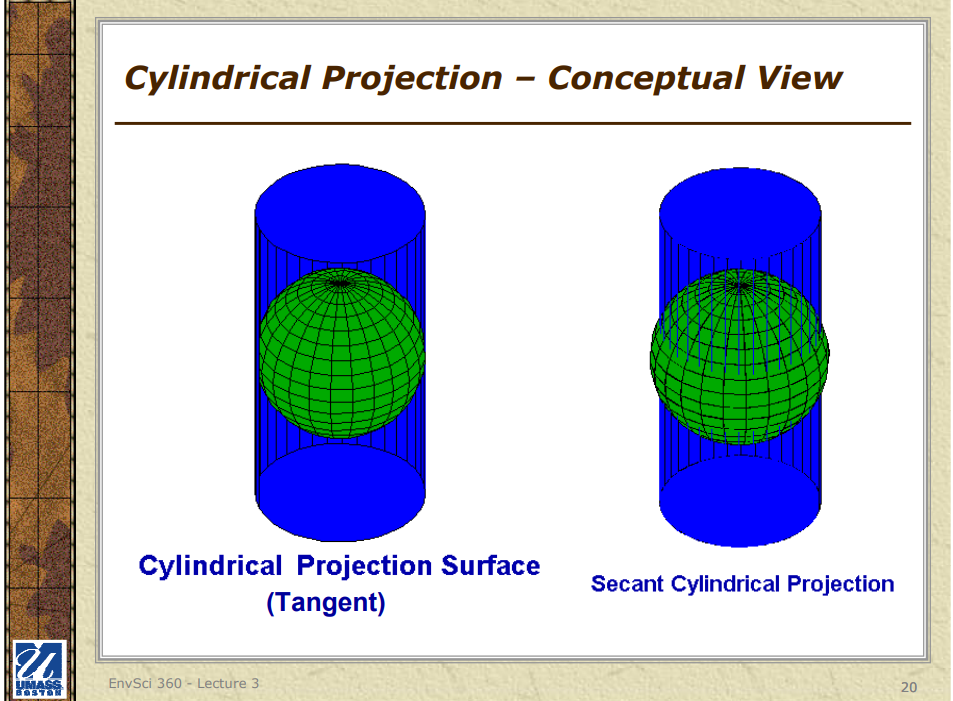
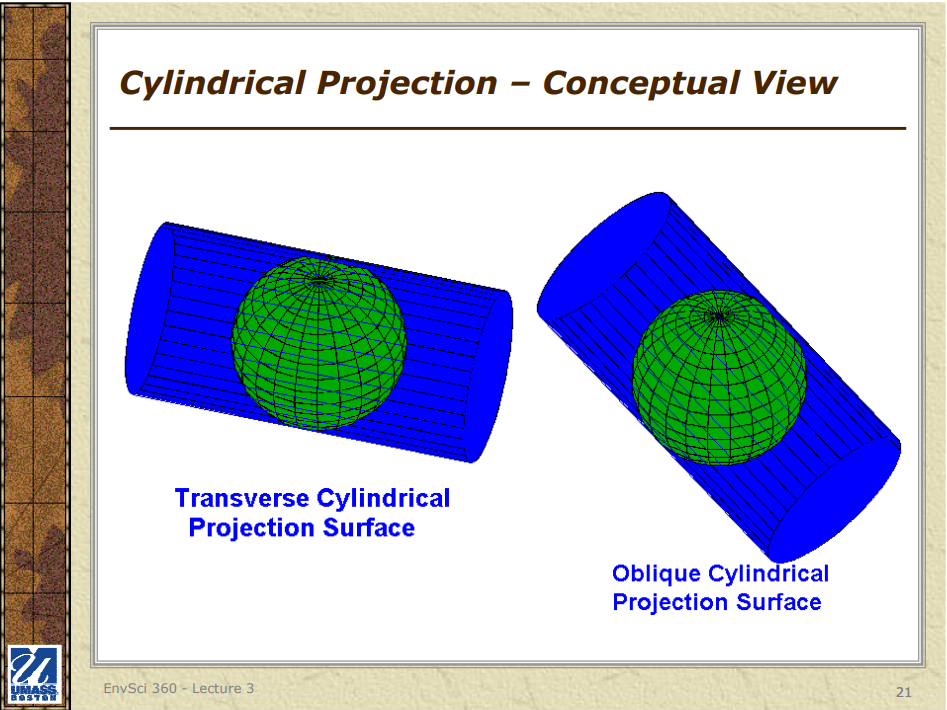
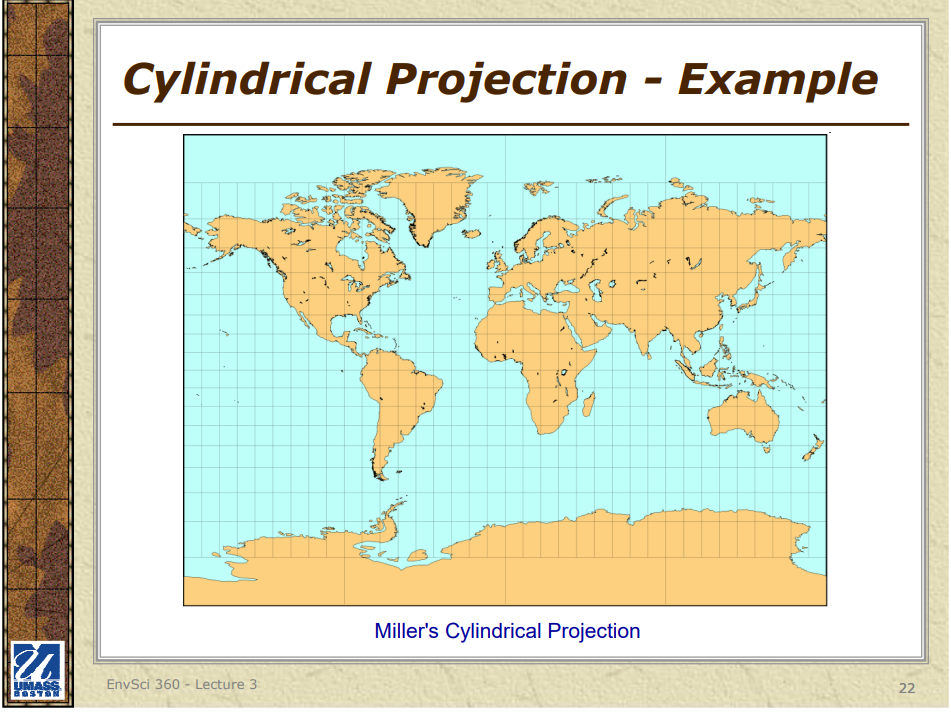
1. Cylindrical Projections: These projections involve wrapping a cylinder around the Earth and projecting its features onto the cylindrical surface. Examples are the Mercator, Transverse Mercator, and Miller Cylindrical projections.
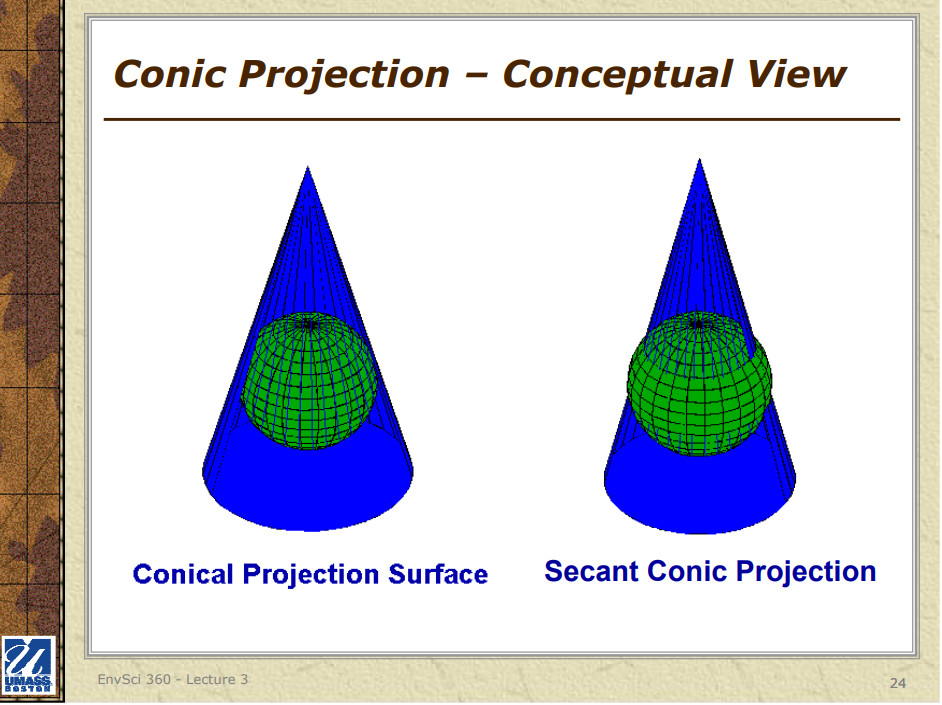
2. Conic Projections: For these projections, a cone is placed over the Earth, and its features are projected onto the conical surface. Common examples are the Lambert Conformal Conic and Albers Equal-Area Conic projections.
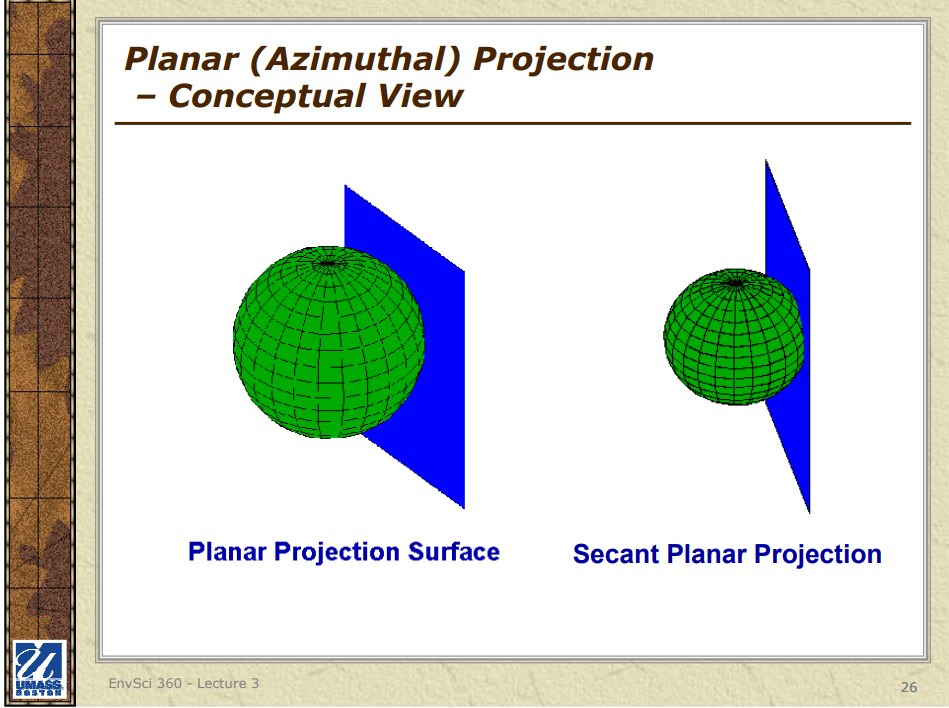
3. Azimuthal Projections: Also referred to as planar or zenithal projections, these use a flat plane that touches the Earth at a single point, projecting the Earth’s features onto the plane. Azimuthal Equidistant, Stereographic, and Orthographic projections are examples.
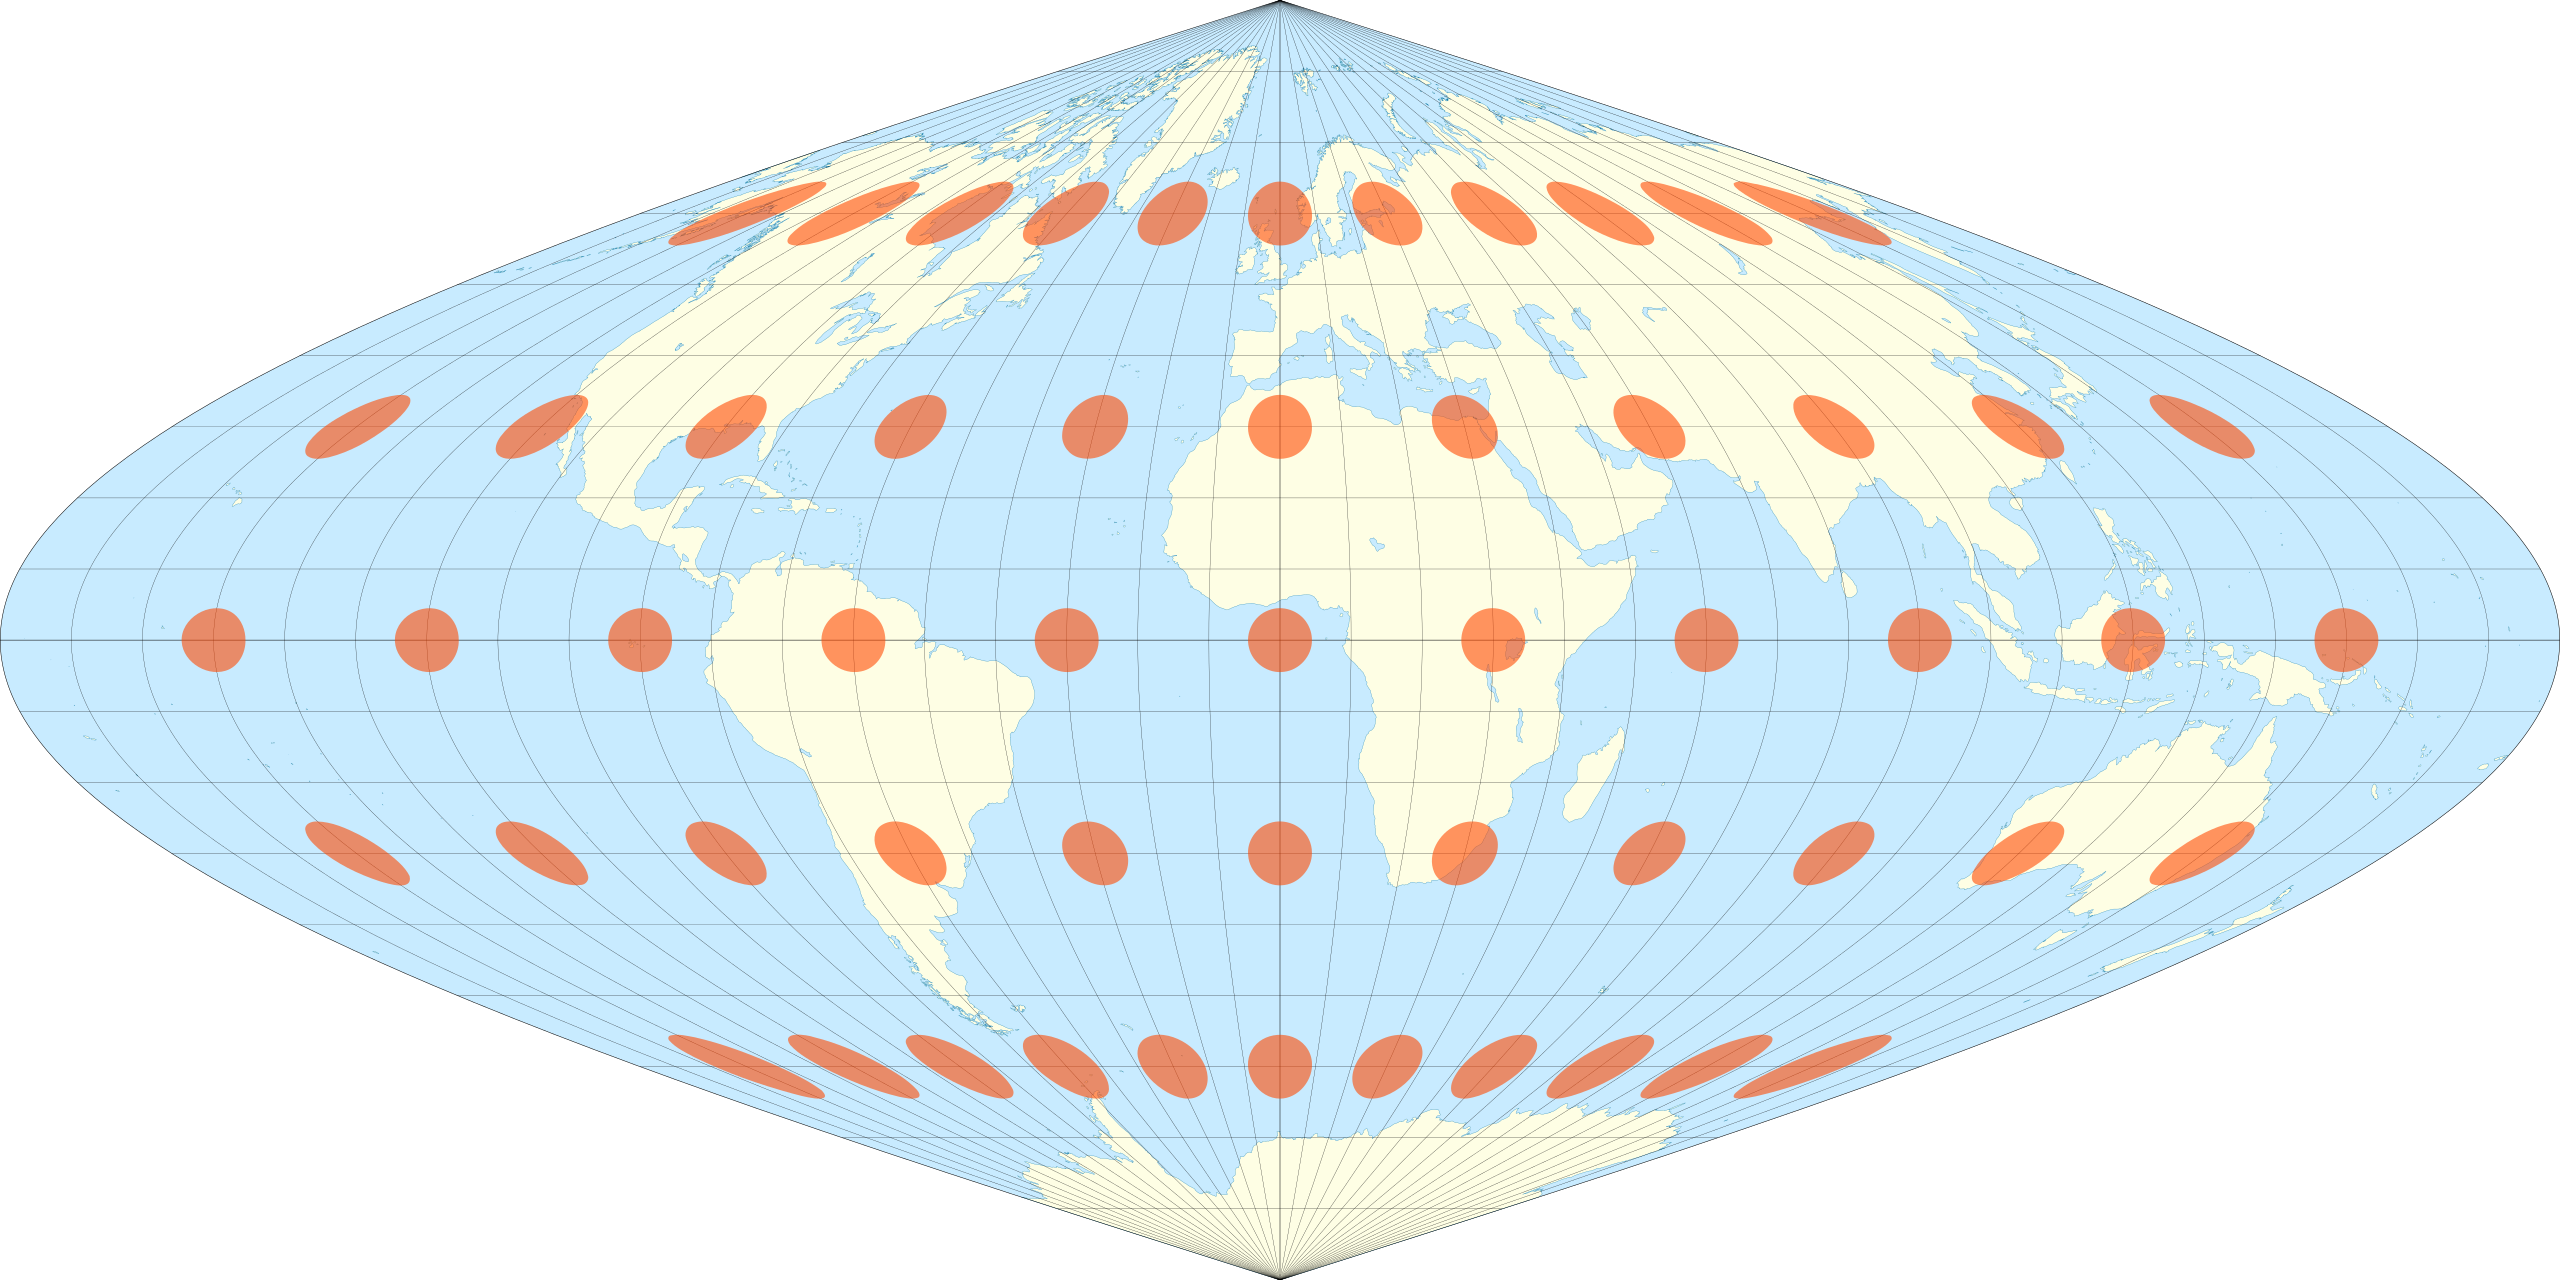
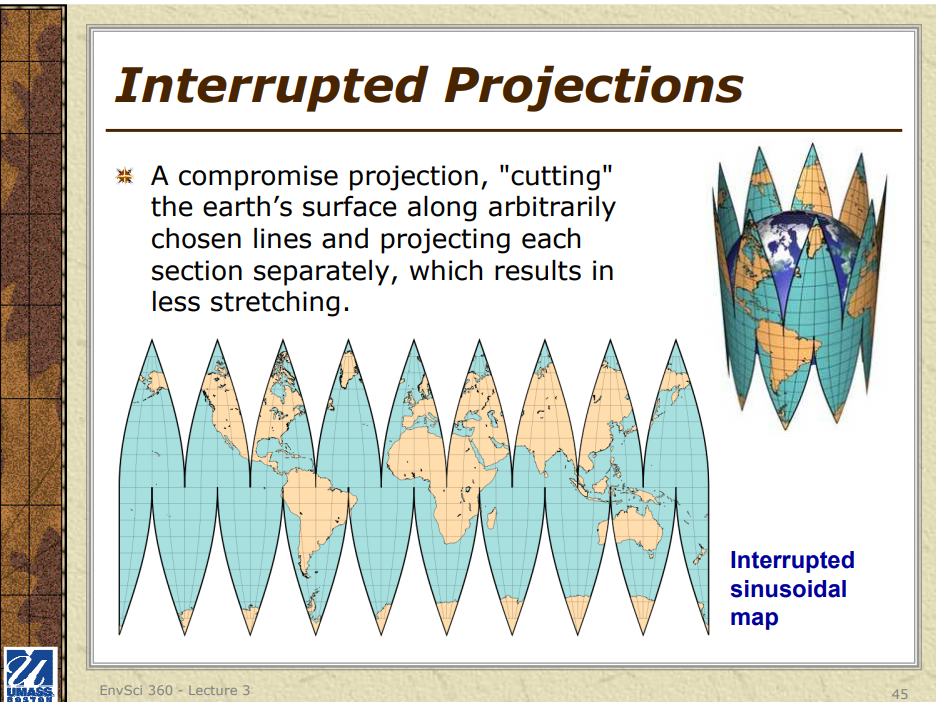
4. Pseudocylindrical Projections: These projections resemble cylindrical projections but employ curved lines instead of straight lines for meridians and parallels. The Sinusoidal, Mollweide, and Goode Homolosine projections are popular examples.
Map projections can also be classified based on the properties they maintain:
1. Equal-area (equivalent) projections: These projections preserve the correct proportions of areas, such as in the Albers Equal-Area Conic and Mollweide projections.
2. Conformal (orthomorphic) projections: These projections maintain local angles and shapes, as seen in the Mercator and Lambert Conformal Conic projections.
3. Equidistant projections: These projections retain true distances from one or two points to all other points, as in the Azimuthal Equidistant projection.
4. Azimuthal projections: These projections preserve directions from a central point, including some conformal, orthomorphic, and azimuthal projections.
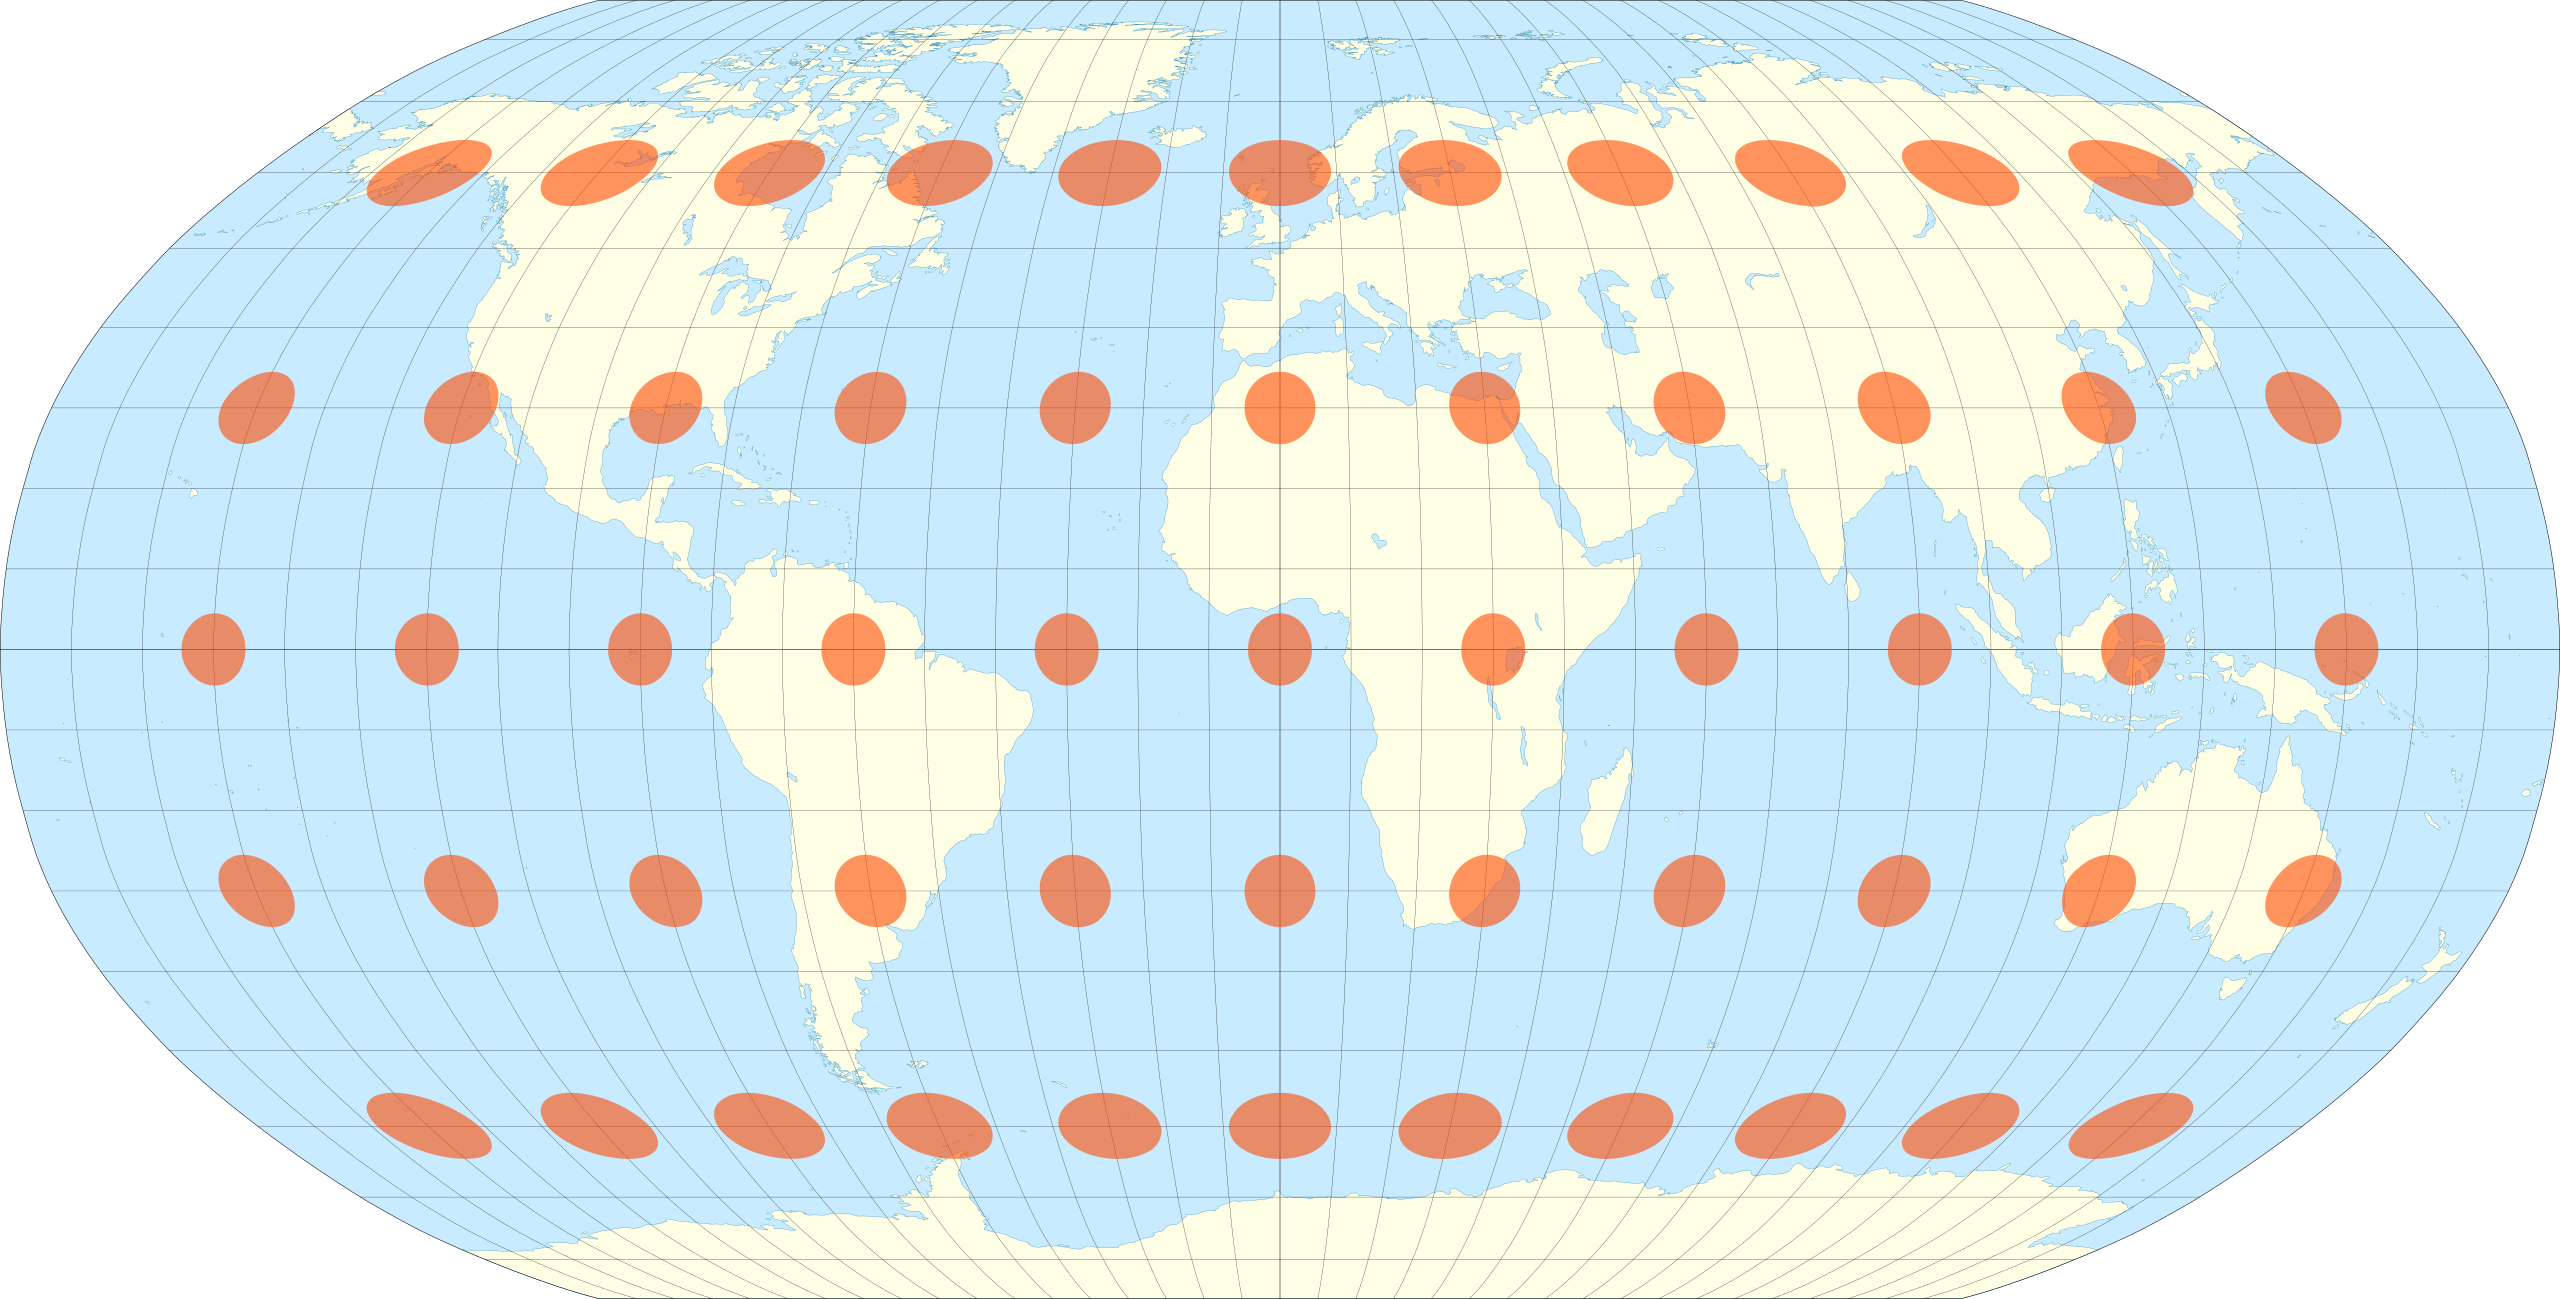
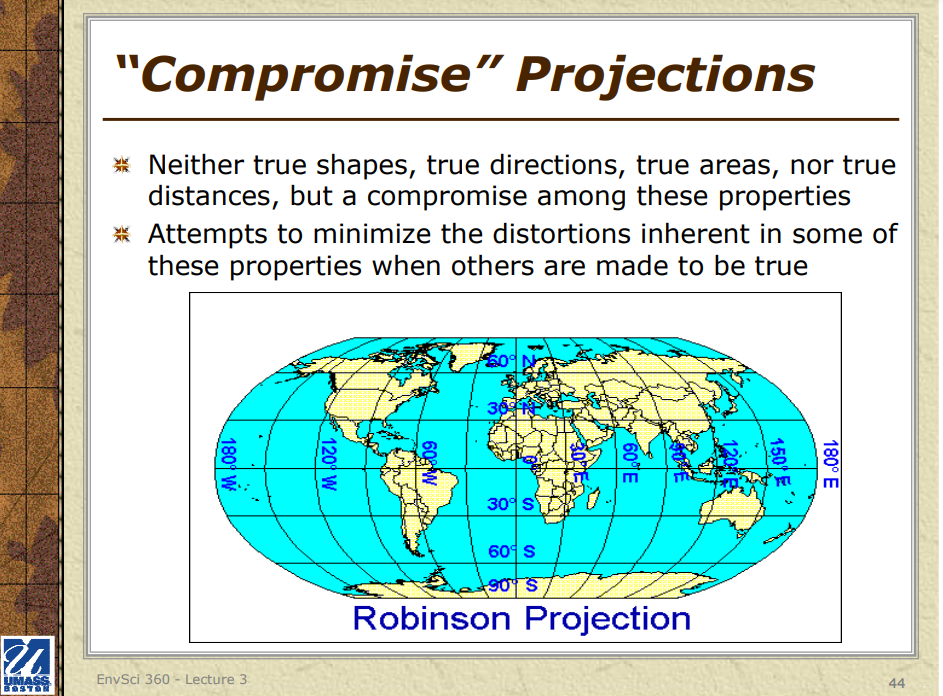
5. Compromise projections: These projections attempt to balance various distortions inherent in map projections, such as the Robinson and Winkel Tripel projections.
It is essential to understand that no map projection can perfectly preserve all properties, as each type entails some degree of compromise or distortion.

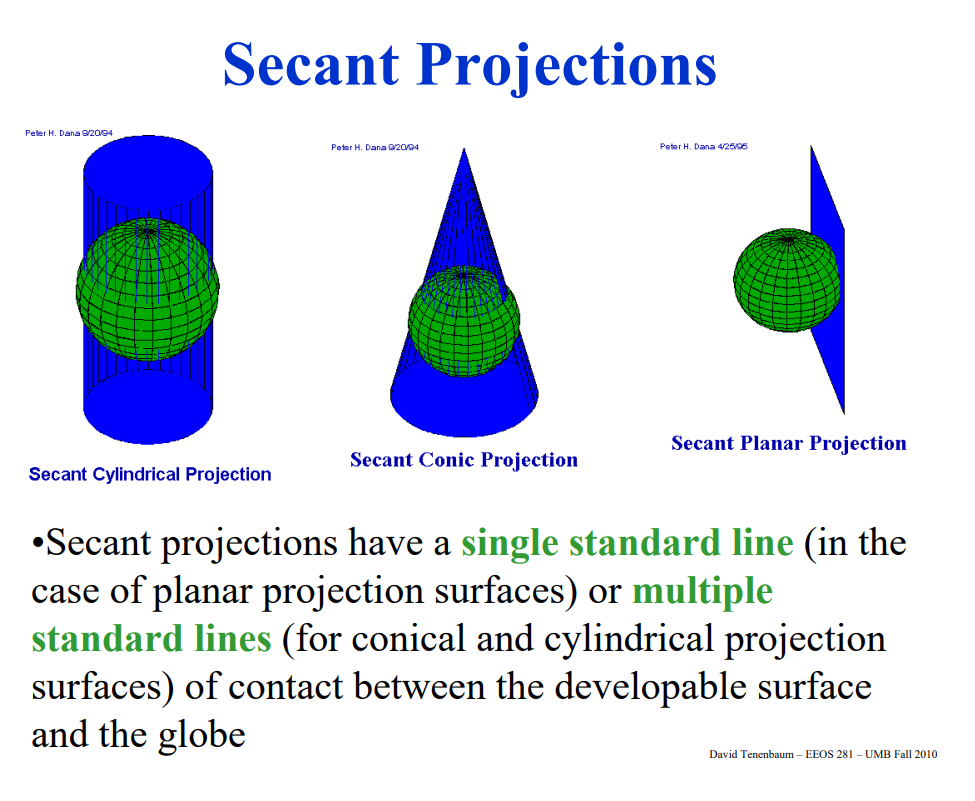

Like the cylindrical projection, conic map projections have parallels that cross the meridians at right angles with a [constant measure of map distortion](https://www.geographyrealm.com/tissots-indicatrix-measuring-distortion-map-projections/) throughout. Conic map projections are designed to be able to be wrapped around a cone on top of a sphere (globe), but aren’t supposed to be geometrically accurate.
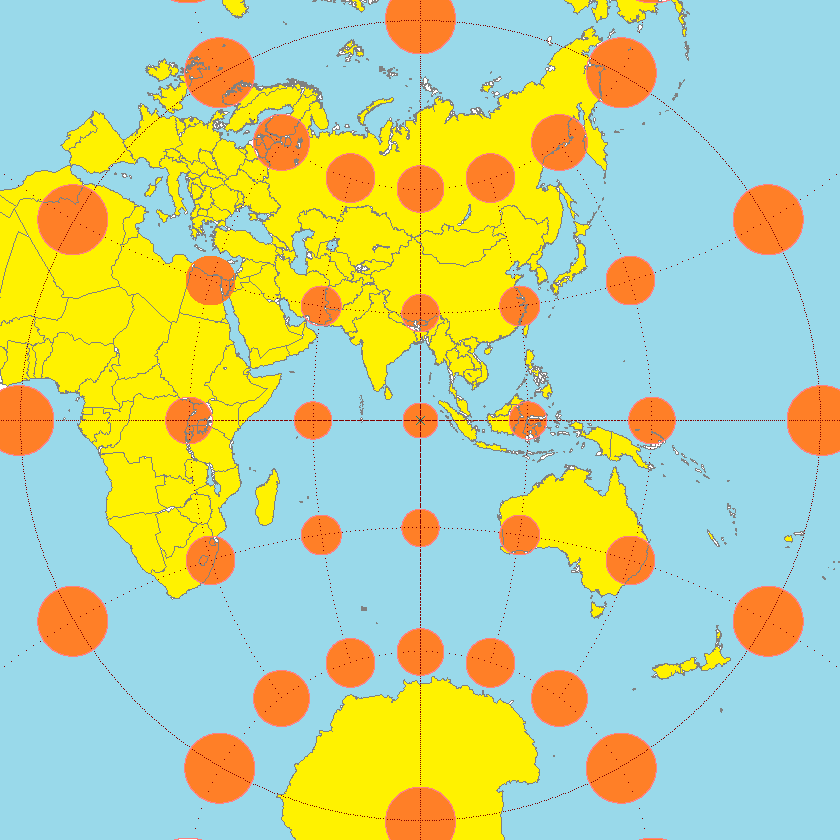
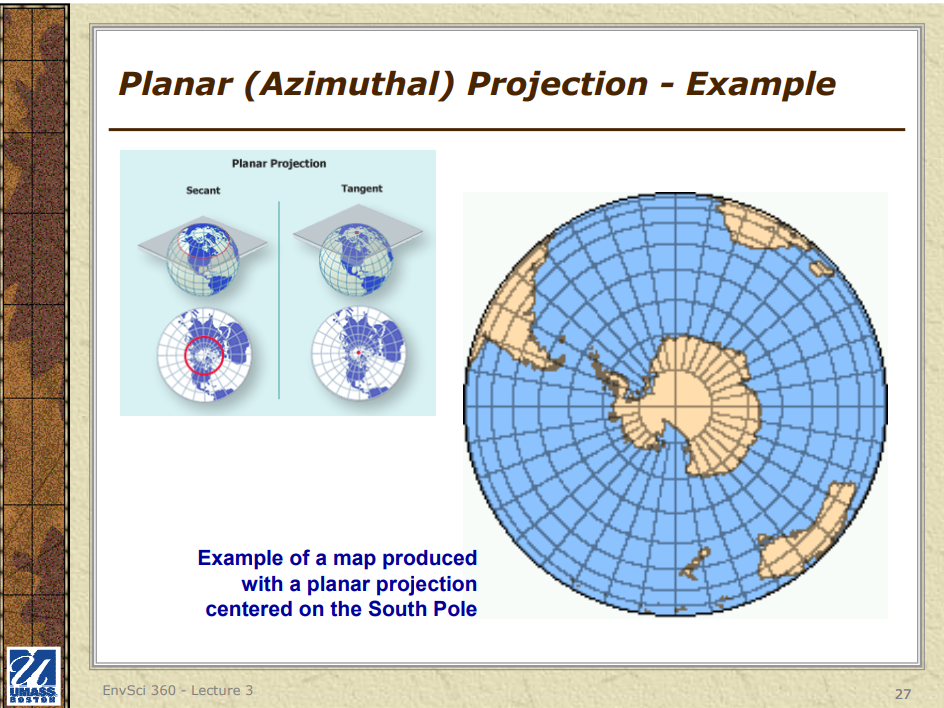
### Azimuthal Equidistant Projection
The Azimuthal Equidistant projection is a planar projection that maintains accurate distances from the center point to any other point on the map. This projection is frequently used for polar maps, where the center point represents the North or South Pole.
This map projection is also commonly utilized for radio and telecommunications planning, as it accurately represents distances between the central point and other locations.
### Robinson Projection
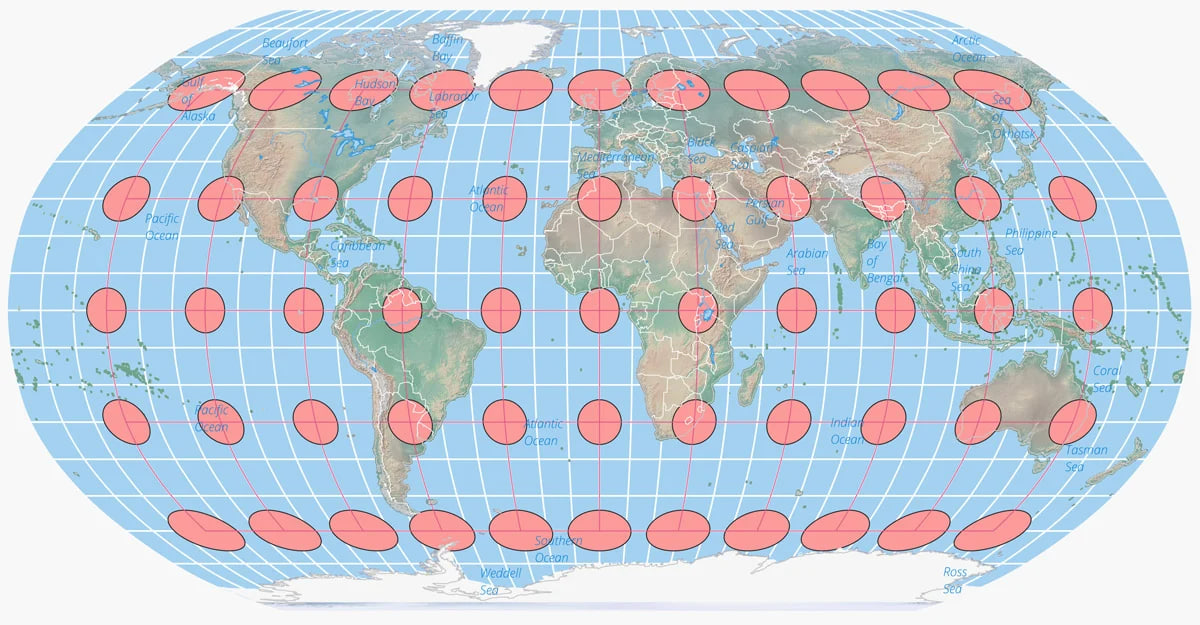
The [Robinson map projection](https://www.geographyrealm.com/robinson-map-projection/), developed by Arthur H. Robinson in 1963, is a compromise projection that balances the distortions of area, shape, distance, and direction.
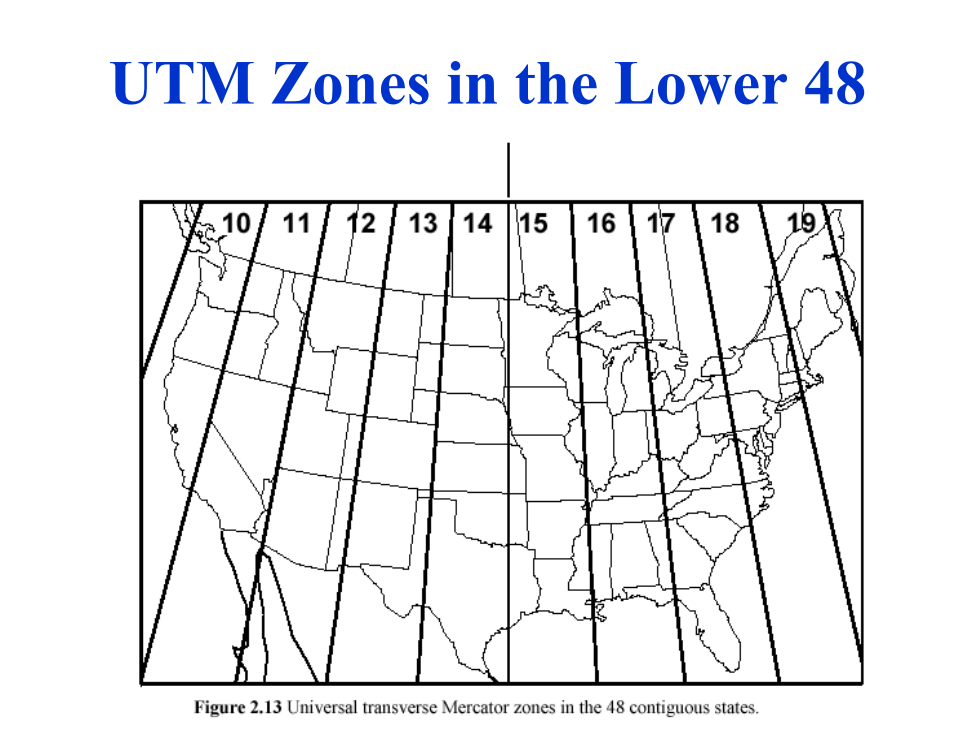
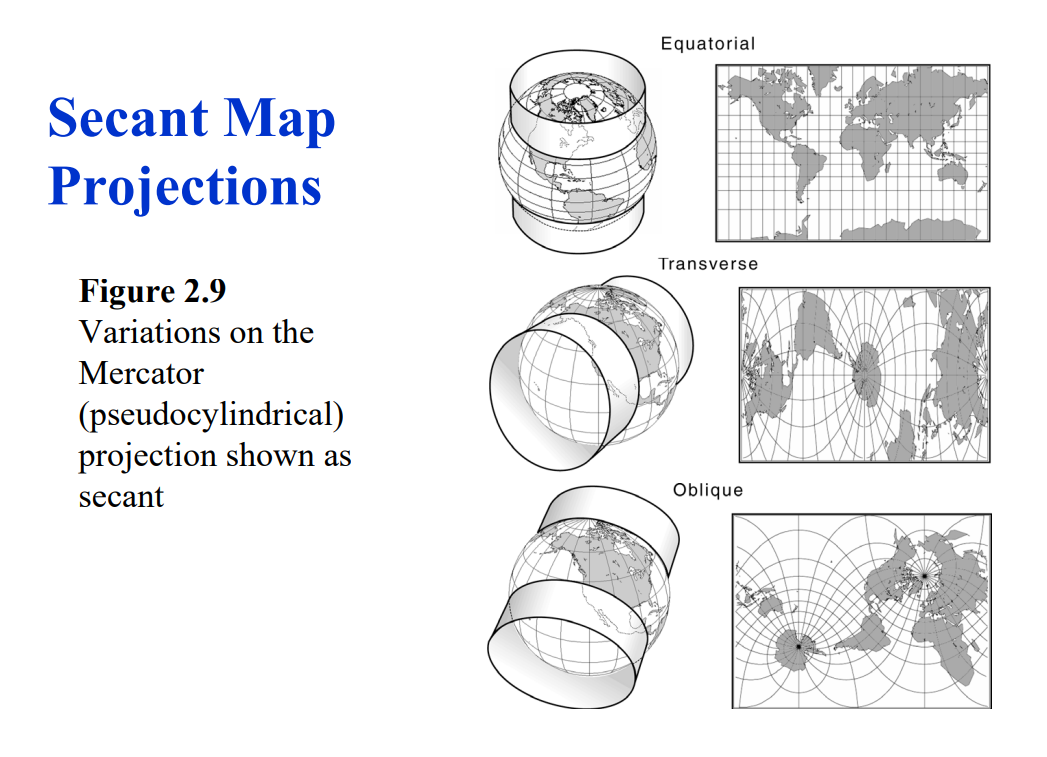
## TRANSVERSE MERCATOR PROJECTION
The Transverse Mercator projection is widely used around the world and works especially well for mapping areas smaller than a few degrees longitudinally, such as a state or county.
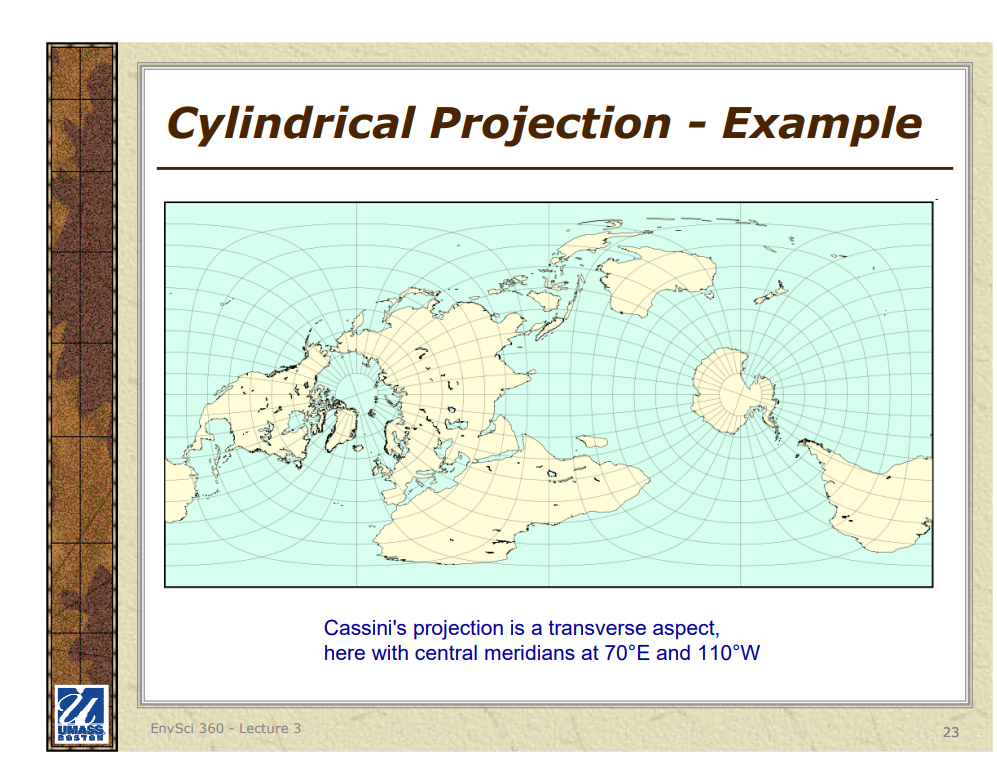
The Transverse Mercator is a revision to the standard Mercator projection in which the cylinder is longitudinally along a meridian instead of the equator.
This conformal projection does not maintain true direction (especially evident at large scales) but this distortion can be minimized by placing the central meridian at the region of interest; this is why the Universal Transverse Mercator (UTM) coordinate system uses “zones” that each have their own central meridian. This projection is commonly used on topographic maps, geological maps, and U.S. Geological Survey maps.
## HOW DISTORTION IS SHOWN ON A MAP
[https://en.wikipedia.org/wiki/Tissot's_indicatrix#](https://en.wikipedia.org/wiki/Tissot's_indicatrix#)
### 1. Cylindrical Projections
**Characteristics**:
- In cylindrical projections, the globe is projected onto a cylinder.
- The cylinder is typically wrapped around the Equator and then unwrapped into a flat map.
- Parallels and meridians appear as straight, perpendicular lines.
**Types**:
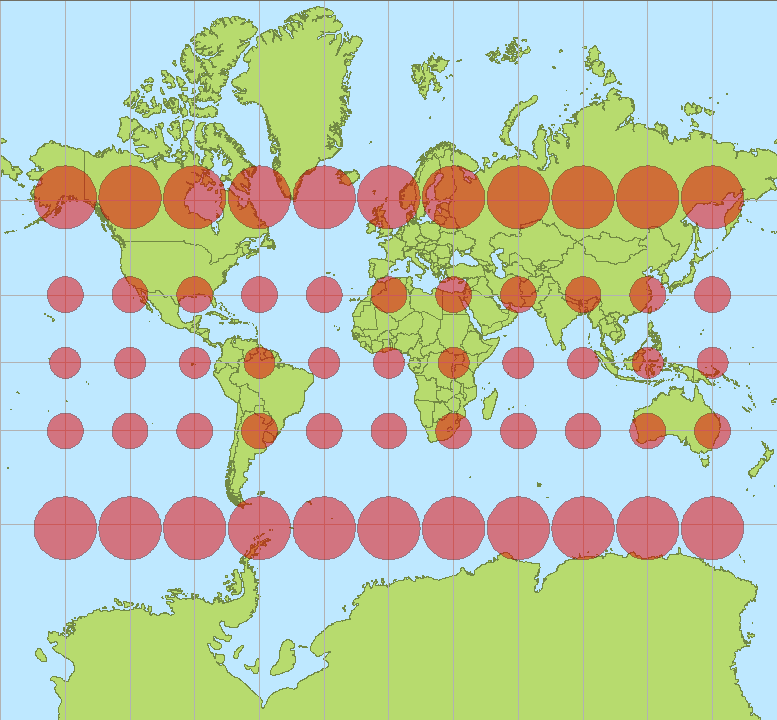
- **Mercator Projection**: Preserves angles and shapes of small areas but distorts size, especially near the poles.
- **Transverse Mercator Projection**: Oriented along a meridian rather than the Equator, used for mapping narrow regions extending north-south.
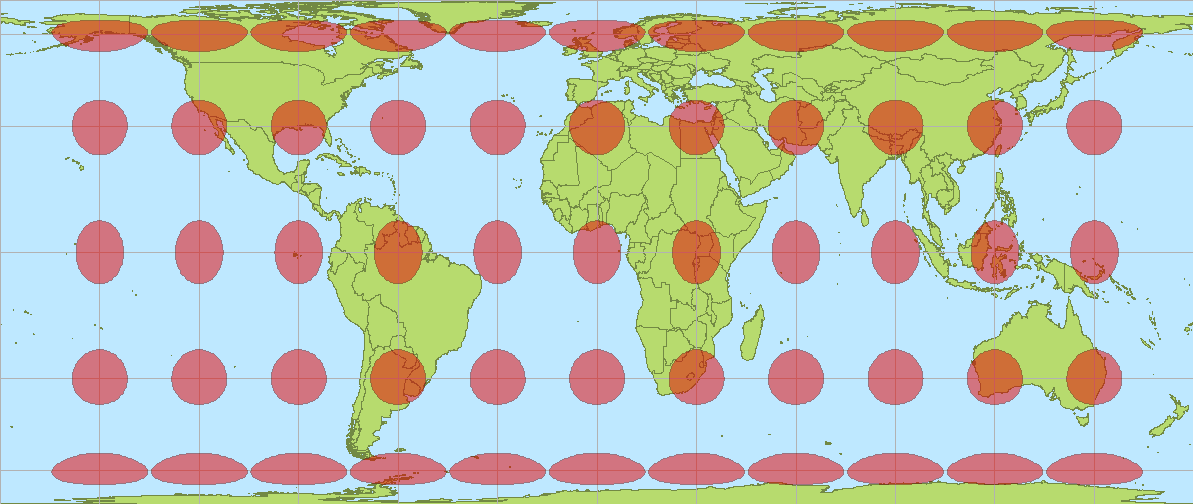
- **Gall-Peters Projection**: Preserves area, providing an equal-area map but distorts shapes.
**Advantages**:
- Useful for navigation because straight lines represent constant compass bearings.
- Simple to construct and read.
- Good for mapping equatorial regions.
**Disadvantages**:
- Distorts size and shape, especially near the poles.
- Not suitable for representing global distributions accurately.
### 2. Conical Projections
**Characteristics**:
- In conical projections, the globe is projected onto a cone.
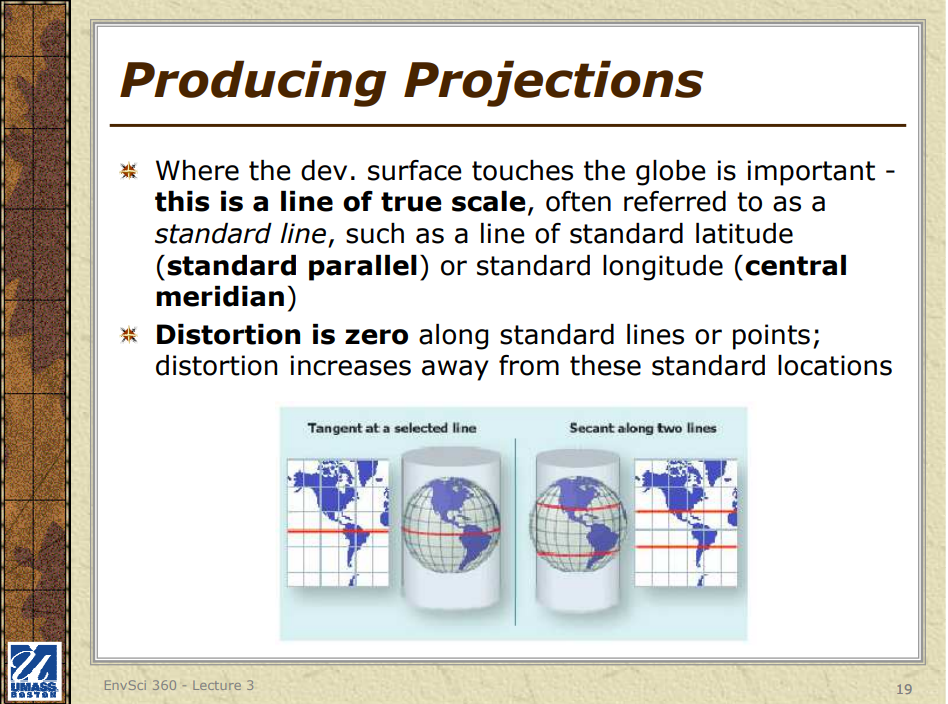
- The cone is usually tangent to the globe along a standard parallel or secant along two standard parallels, then unwrapped into a flat map.
- Parallels appear as arcs of circles, and meridians appear as straight lines radiating from the cone's apex.
**Types**:
- **Albers Equal-Area Conic Projection**: Preserves area, useful for statistical maps of mid-latitude regions.
- **Lambert Conformal Conic Projection**: Preserves shape locally, useful for aeronautical charts and mapping regions with east-west orientation.
**Advantages**:
- Provides a good balance between size and shape distortion.
- Suitable for mapping mid-latitude regions with east-west orientation.
- Often used for regional and national maps.
**Disadvantages**:
- Distorts scale and shape near the poles and equator.
- Not suitable for global maps.
### 3. Planar (Azimuthal) Projections
**Characteristics**:
- In planar projections, the globe is projected onto a flat plane.
- The plane typically touches the globe at one point (tangent) or cuts through the globe (secant).
- Parallels appear as concentric circles, and meridians appear as straight lines radiating from the central point.
**Types**:
- **Stereographic Projection**: Preserves angles, useful for navigation and meteorological charts.
- **Azimuthal Equidistant Projection**: Preserves distances from the center point to any other point, useful for radio and seismic mapping.
- **Orthographic Projection**: Provides a perspective view of the Earth, similar to a photograph from space.
**Advantages**:
- Accurate for specific points or regions (e.g., the poles or the center of the map).
- Useful for certain types of analysis (e.g., seismic or radio wave propagation).
**Disadvantages**:
- Distorts shape and area, especially near the edges.
- Not suitable for mapping large areas accurately.
### Summary
#### Cylindrical Projections
- **Best For**: Navigation and equatorial regions.
- **Main Advantage**: Preserves angles and shapes of small areas.
- **Main Disadvantage**: Significant distortion of size, especially near the poles.
#### Conical Projections
- **Best For**: Mid-latitude regions with east-west orientation.
- **Main Advantage**: Balanced distortion, suitable for regional maps.
- **Main Disadvantage**: Not suitable for global maps, with distortions near poles and equator.
#### Planar (Azimuthal) Projections
- **Best For**: Specific points or regions, polar areas, and certain types of analysis.
- **Main Advantage**: Accurate for distances from the center point.
- **Main Disadvantage**: Distorts shape and area, especially away from the center.
Each type of projection serves different purposes and is chosen based on the specific needs of the map, such as the area to be mapped, the importance of preserving certain properties (like area, shape, or distance), and the intended use of the map. Understanding these differences helps in selecting the appropriate projection for any given mapping task.
## other coordinate systems projected onto maps
In addition to the geographic coordinate system (latitude and longitude), various other coordinate systems are projected onto maps to serve specific purposes. Here are some key types of coordinate systems commonly used in mapping:
### 1. UTM (Universal Transverse Mercator)
**Description**:
- **Projection**: Transverse Mercator
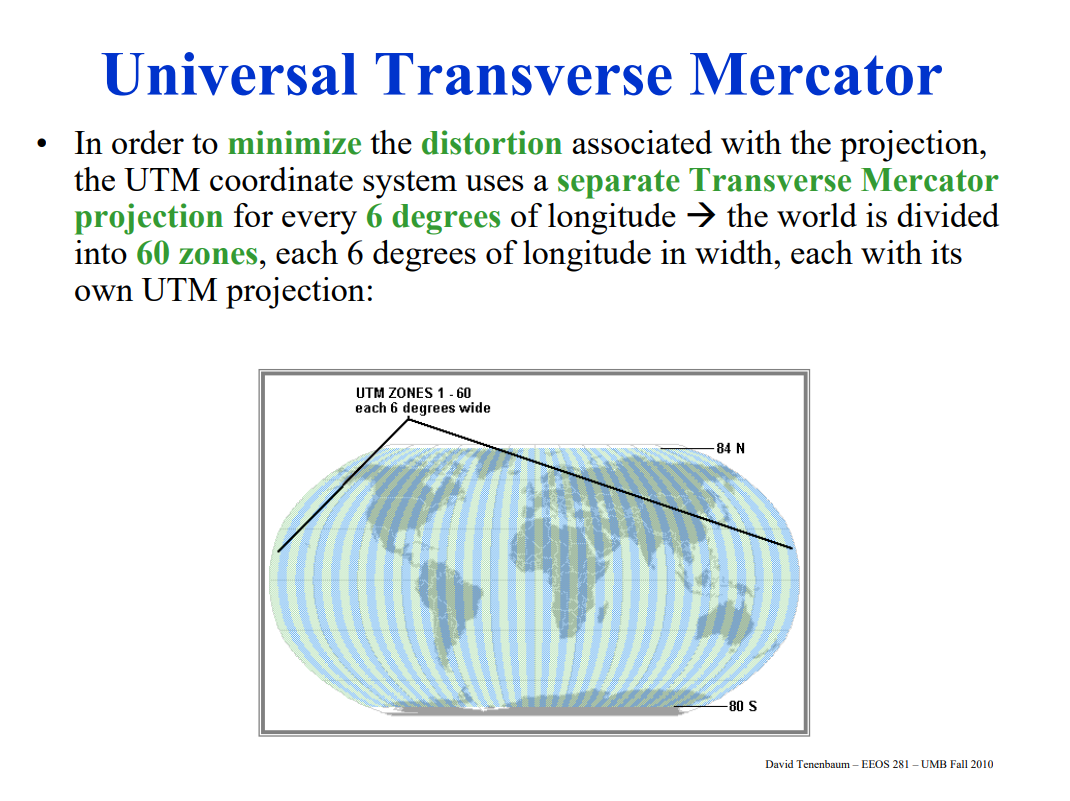
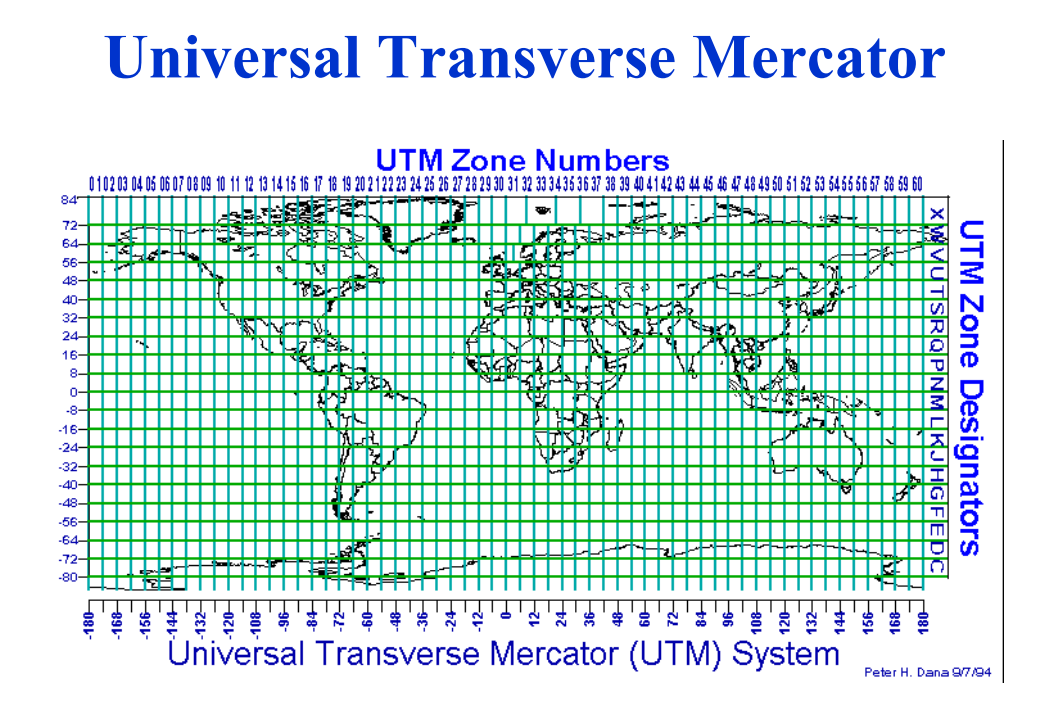
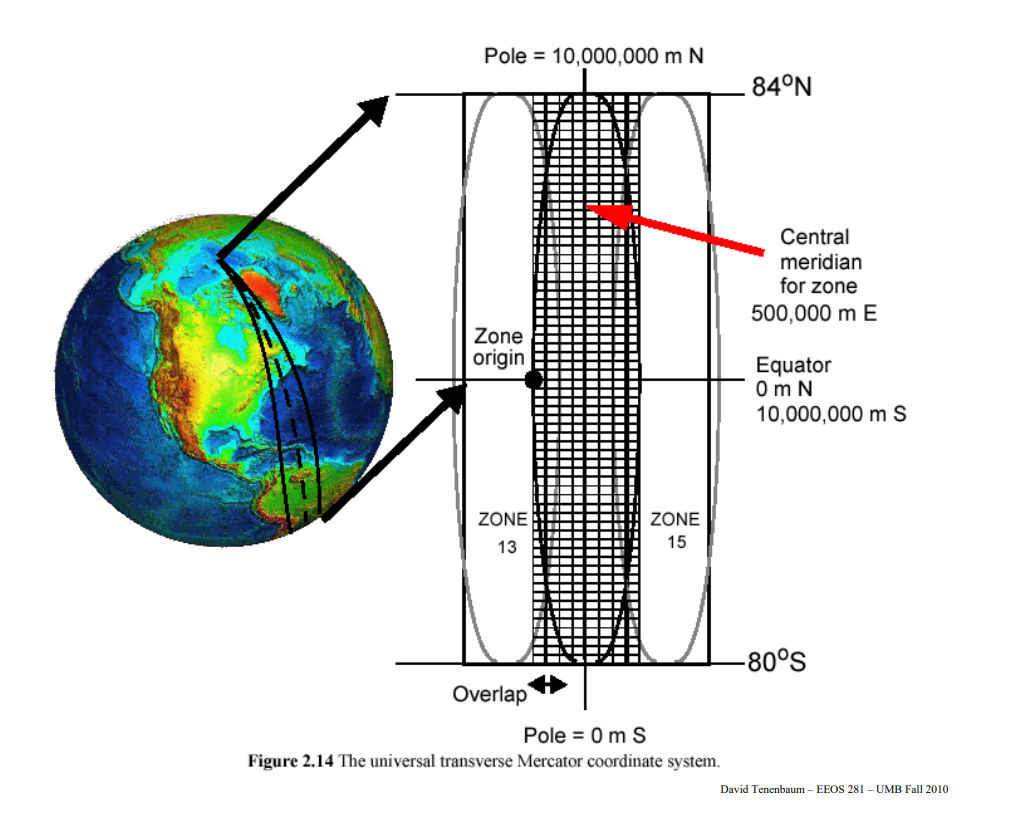
- **Division**: The world is divided into 60 zones, each 6 degrees of longitude wide.
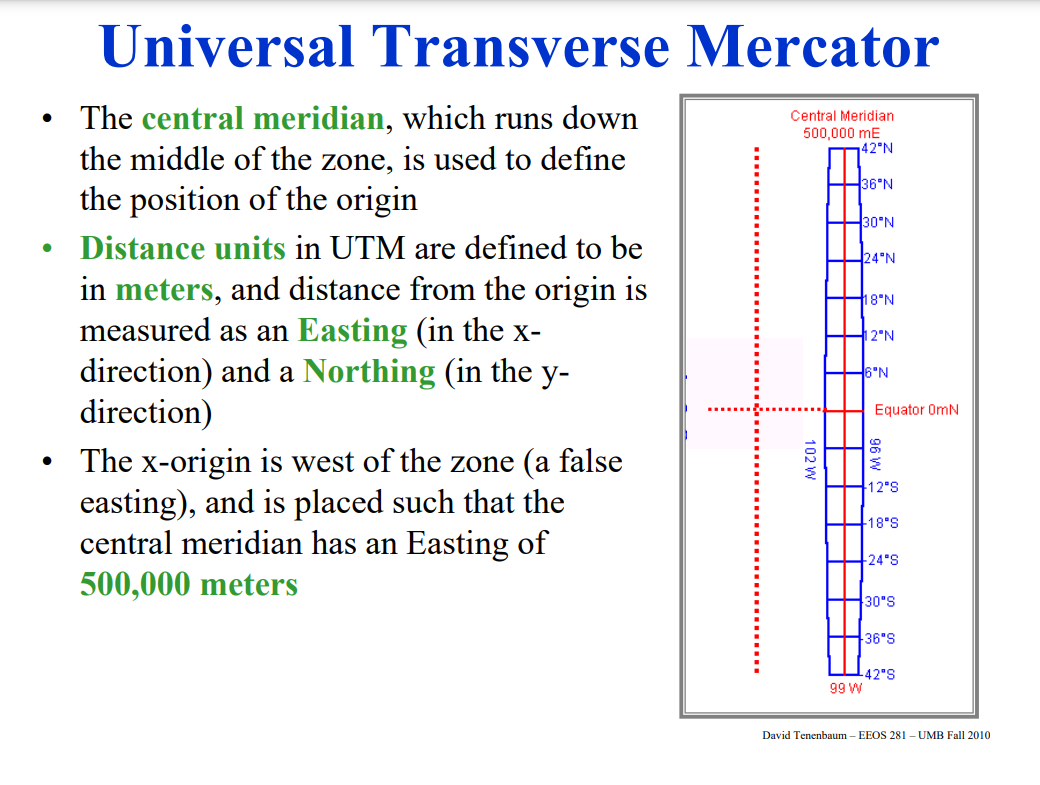
- **Coordinates**: Each zone has its own coordinate system with easting and northing values.
**Advantages**:
- Provides high accuracy for small areas.
- Minimizes distortion within each zone.
**Disadvantages**:
- Not suitable for global maps because it is only accurate within each zone.
- Zone boundaries can complicate mapping across multiple zones.
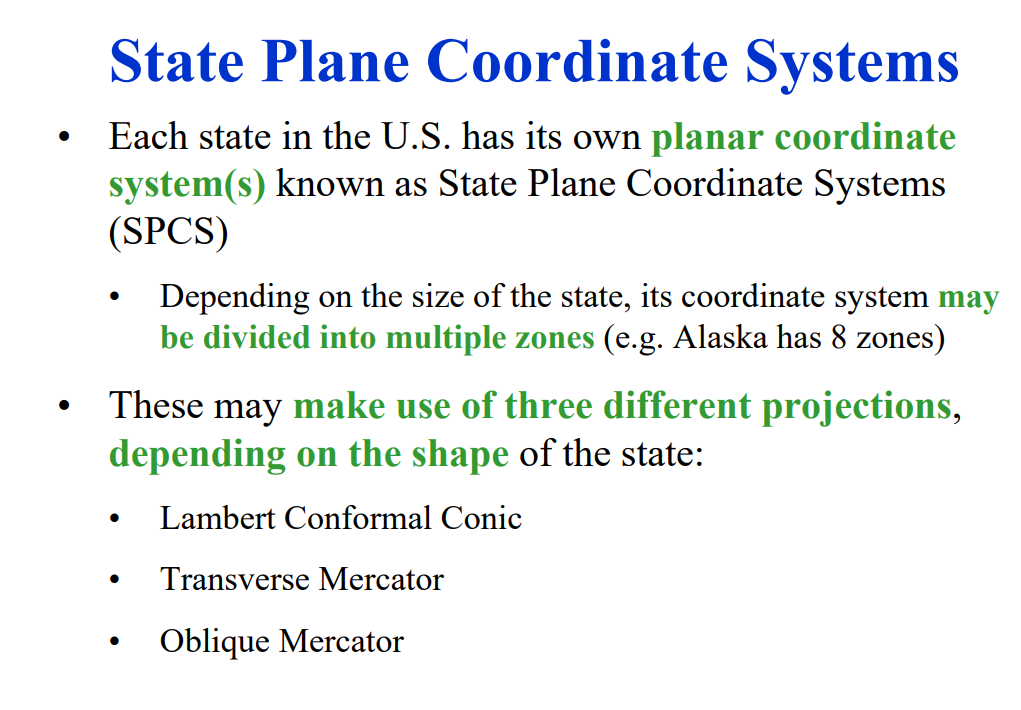
### 2. State Plane Coordinate System (SPCS)
**Description**:
- **Usage**: Primarily used in the United States.
- **Projection**: Uses different projections (Transverse Mercator, Lambert Conformal Conic, or Oblique Mercator) depending on the state or region.
- **Coordinates**: Provides high accuracy for localized areas, with coordinates in feet or meters.
**Advantages**:
- Extremely high accuracy for local and regional mapping.
- Tailored to minimize distortion for specific areas.
**Disadvantages**:
- Limited to specific states or regions.
- Not suitable for national or global mapping.
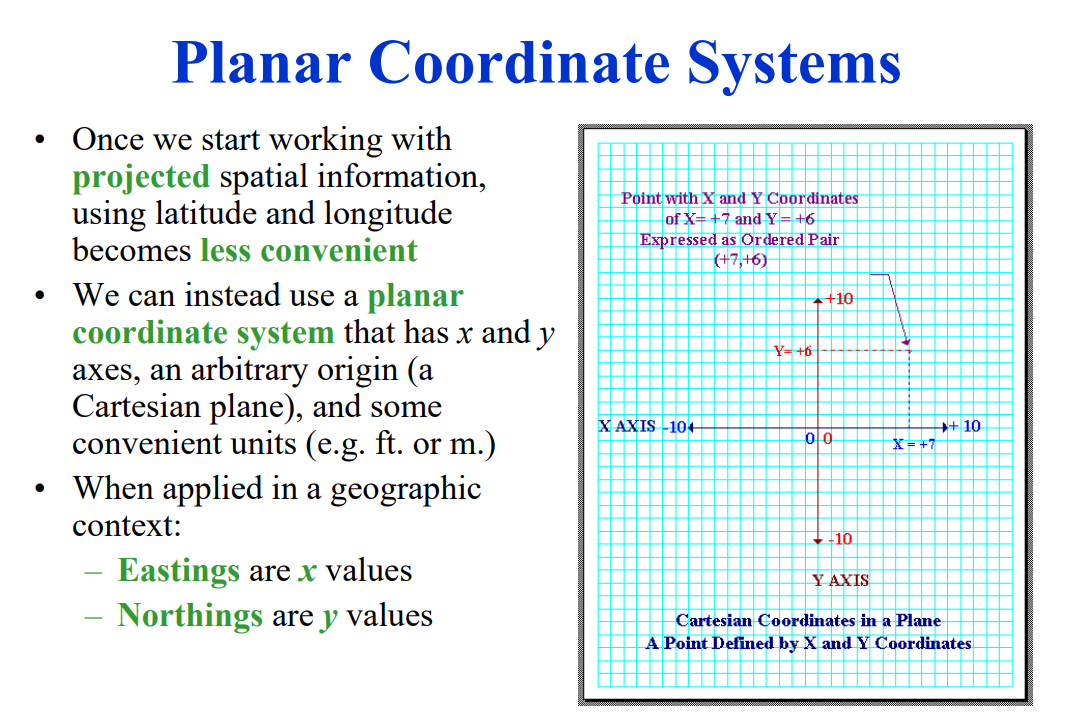
### 3. Cartesian Coordinate System
**Description**:
- **Projection**: Typically used in small, localized areas where curvature of the Earth can be ignored.
- **Coordinates**: Uses (x, y) coordinates for a flat, two-dimensional plane.
**Advantages**:
- Simple and intuitive for small-scale maps.
- Ideal for urban planning, engineering, and construction projects.
**Disadvantages**:
- Not suitable for large areas due to distortion of the Earth's curvature.
- Does not take into account the Earth's shape.
### 4. Military Grid Reference System (MGRS)
**Description**:
- **Projection**: Based on UTM zones.
- **Coordinates**: Combines UTM coordinates with a grid reference system for detailed location reporting.
**Advantages**:
- Provides precise and easy-to-use grid references for military and search and rescue operations.
- Compatible with UTM, allowing for integration with other mapping data.
**Disadvantages**:
- Complexity in converting between MGRS and other coordinate systems.
- Limited to areas where UTM is applicable.
### 5. Local Coordinate Systems
**Description**:
- **Usage**: Designed for specific projects or regions, often for engineering or construction purposes.
- **Projection**: Varies based on the specific needs of the project.
- **Coordinates**: Custom coordinates that fit the project requirements.
**Advantages**:
- Highly accurate for specific projects.
- Tailored to minimize distortion for the project area.
**Disadvantages**:
- Not standardized, making it difficult to integrate with other data.
- Limited to the specific project area.
### 6. Earth-Centered, Earth-Fixed (ECEF) Coordinate System
**Description**:
- **Projection**: A 3D coordinate system that represents locations relative to the center of the Earth.
- **Coordinates**: Uses (X, Y, Z) coordinates based on the center of the Earth.
**Advantages**:
- Provides a global, three-dimensional reference frame.
- Useful for satellite navigation and geospatial applications.
**Disadvantages**:
- Not intuitive for traditional map reading.
- Requires conversion to and from geographic or projected coordinate systems for most mapping applications.
### 7. Geocentric Coordinate System
**Description**:
- **Projection**: Similar to ECEF but can vary depending on the specific application.
- **Coordinates**: Uses (X, Y, Z) coordinates relative to the Earth's center.
**Advantages**:
- Suitable for global positioning and satellite data.
- Provides a consistent reference frame for global applications.
**Disadvantages**:
- Complex and not suitable for traditional flat maps.
- Requires sophisticated conversion tools for use with traditional coordinate systems.
### Conclusion
Besides the geographic coordinate system, several other coordinate systems are projected onto maps to meet specific needs and applications. These include the UTM, State Plane Coordinate System, Cartesian Coordinate System, Military Grid Reference System, Local Coordinate Systems, Earth-Centered Earth-Fixed, and Geocentric Coordinate System. Each system has its own advantages and disadvantages, and the choice of coordinate system depends on the accuracy required, the area being mapped, and the specific use case. Understanding these systems and their applications is crucial for accurate mapping and spatial analysis.
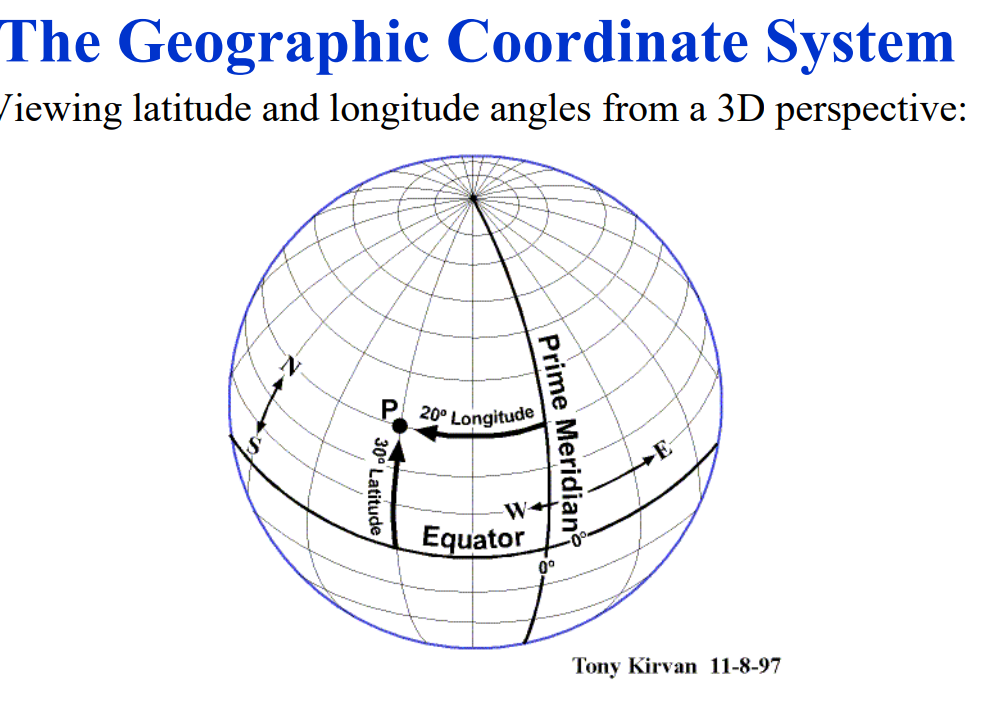
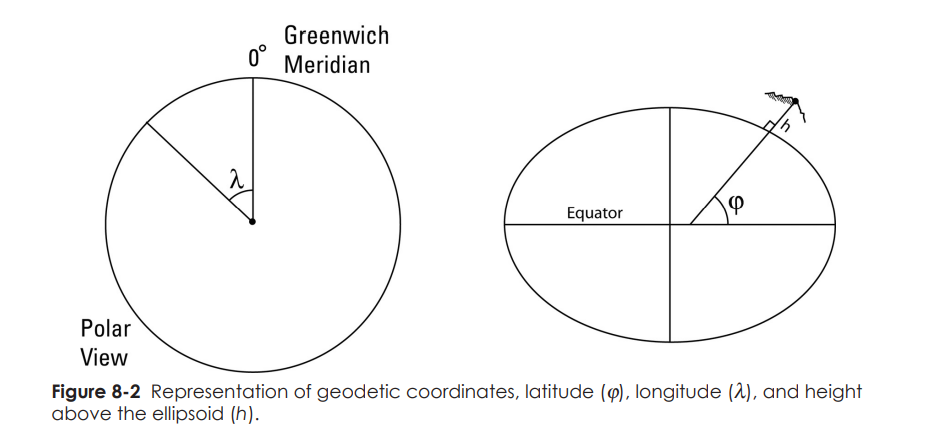
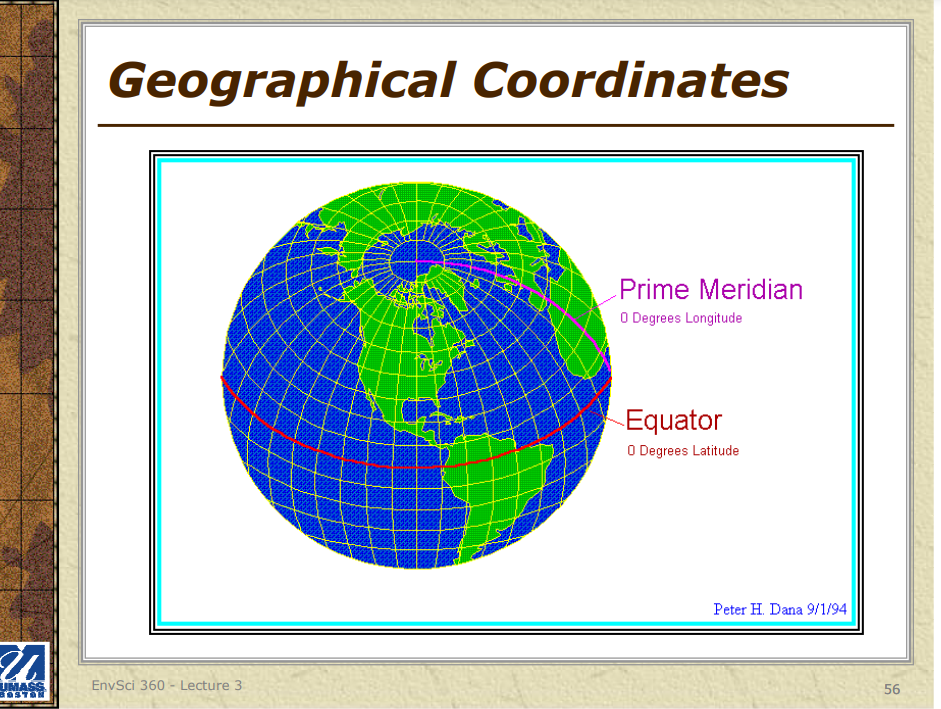
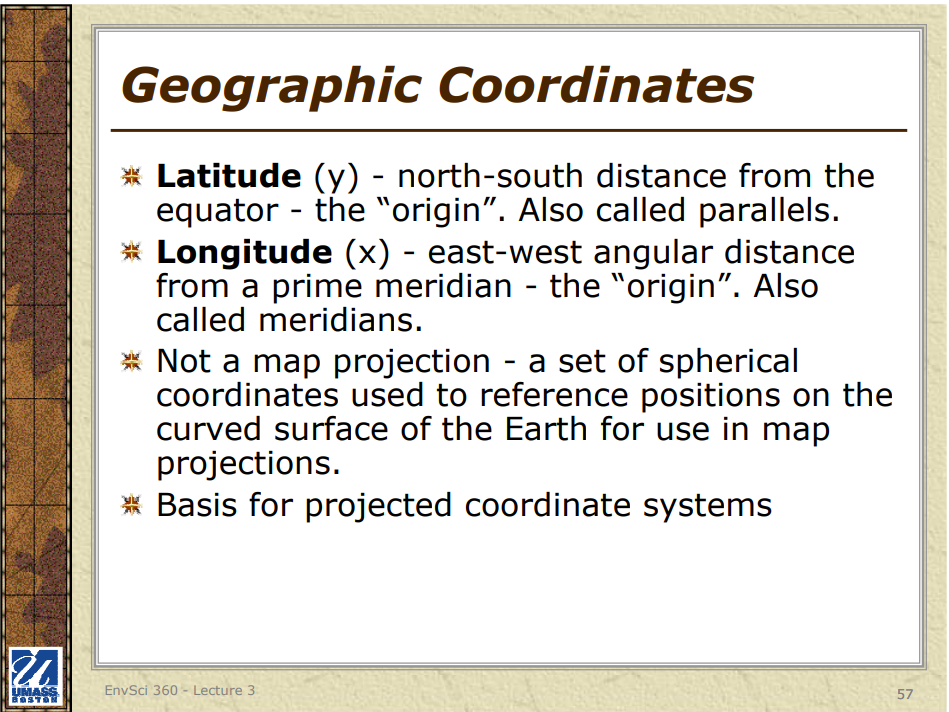
## A geographic coordinate system (GCS)
is a spherical or geodetic coordinate system for measuring and communicating positions directly on Earth as latitude and longitude. It is the simplest, oldest and most widely used of the various spatial reference systems that are in use, and forms the basis for most others. Although latitude and longitude form a coordinate tuple like a cartesian coordinate system, the geographic coordinate system is not cartesian because the measurements are angles and are not on a planar surface.
## MAPS ARE ALWAYS DISTORTED
Different map projections have different problems with their individual distortions; distances between objects and the objects themselves are often inaccurate in some way.
---
They claim that all maps are distorted because all maps are globe maps. This is wrong, but not far from the actual truth. If all maps are just projections of the coordinate system of the sky, then why is the globe the only one that matches the geodesic distances inherent within the globe? EXCELLENT Question.!
Lets first look at the math describing the distortions.
## WHO CREATED THE TISSOT’S INDICATRIX TO MEASURE MAP DISTORTION?
.gif)
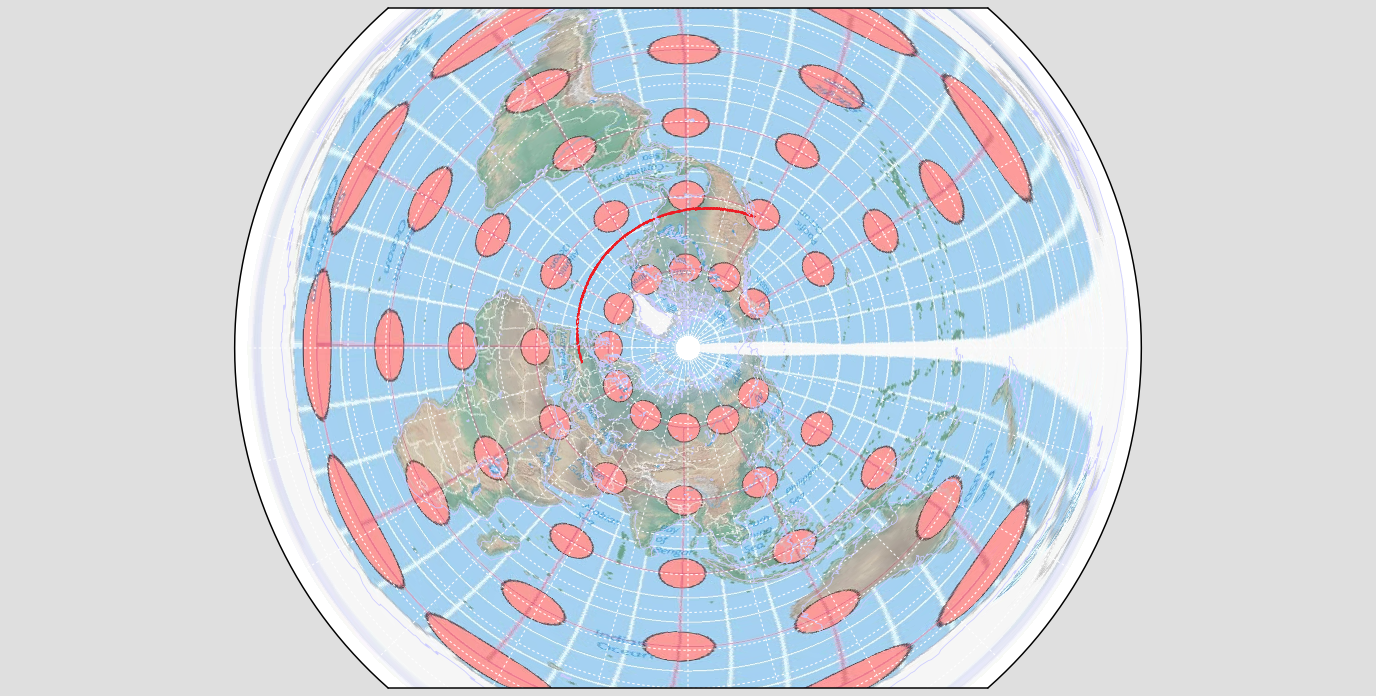
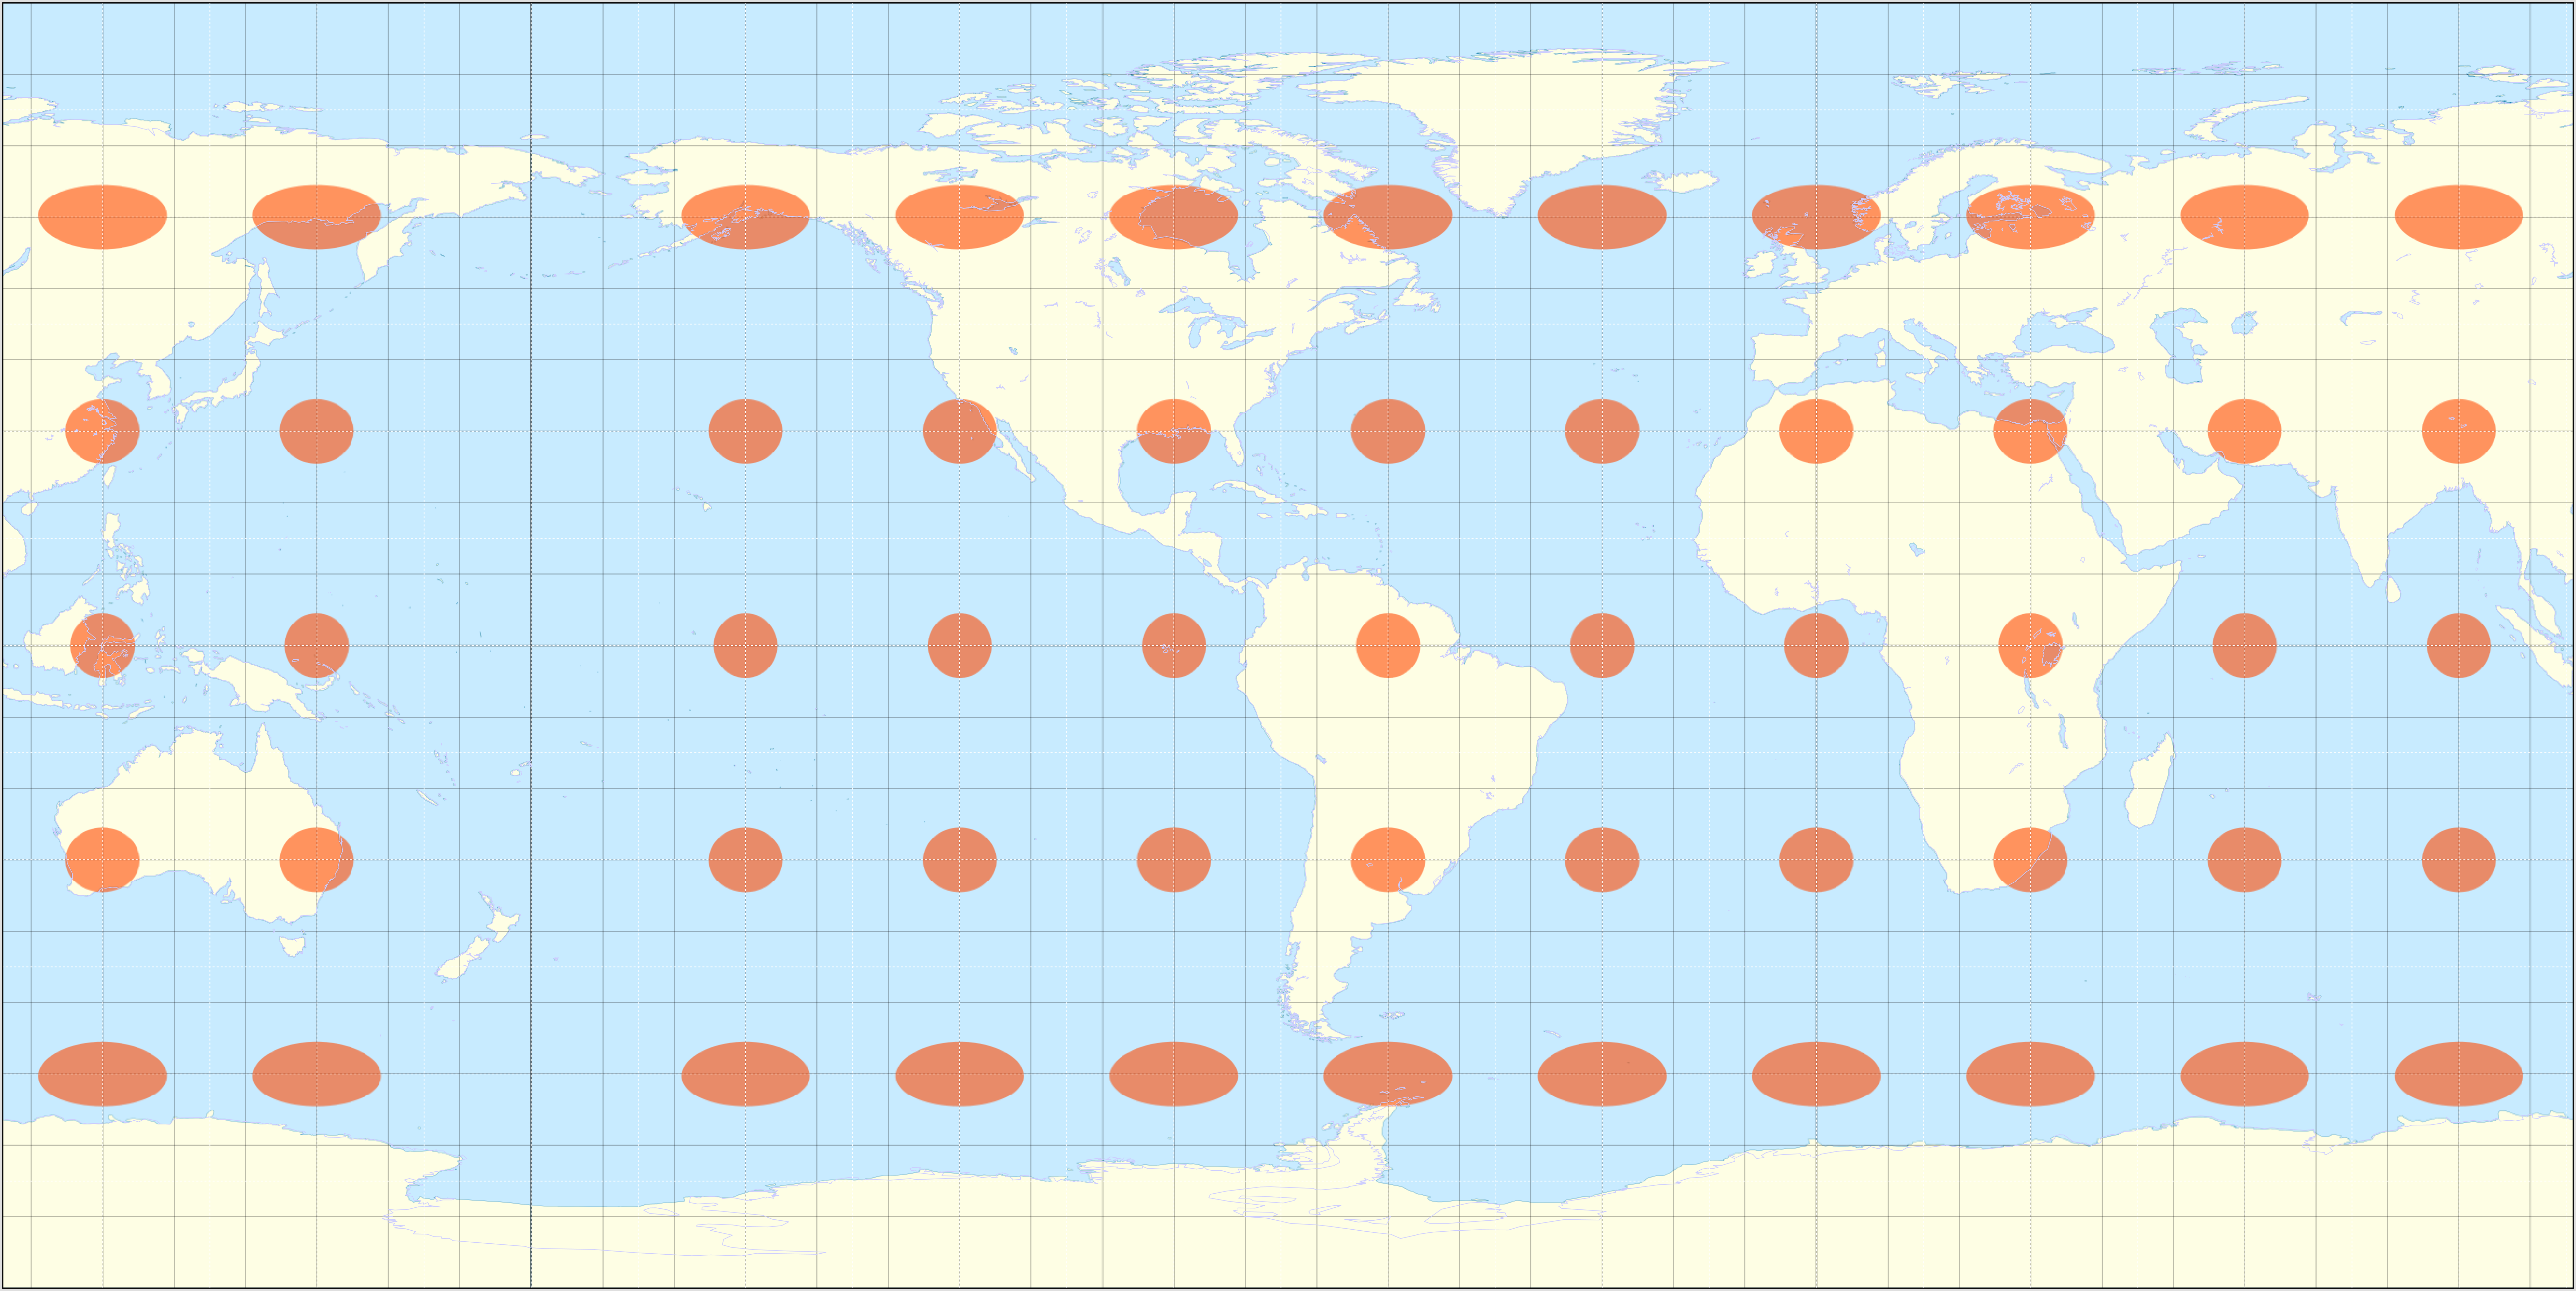
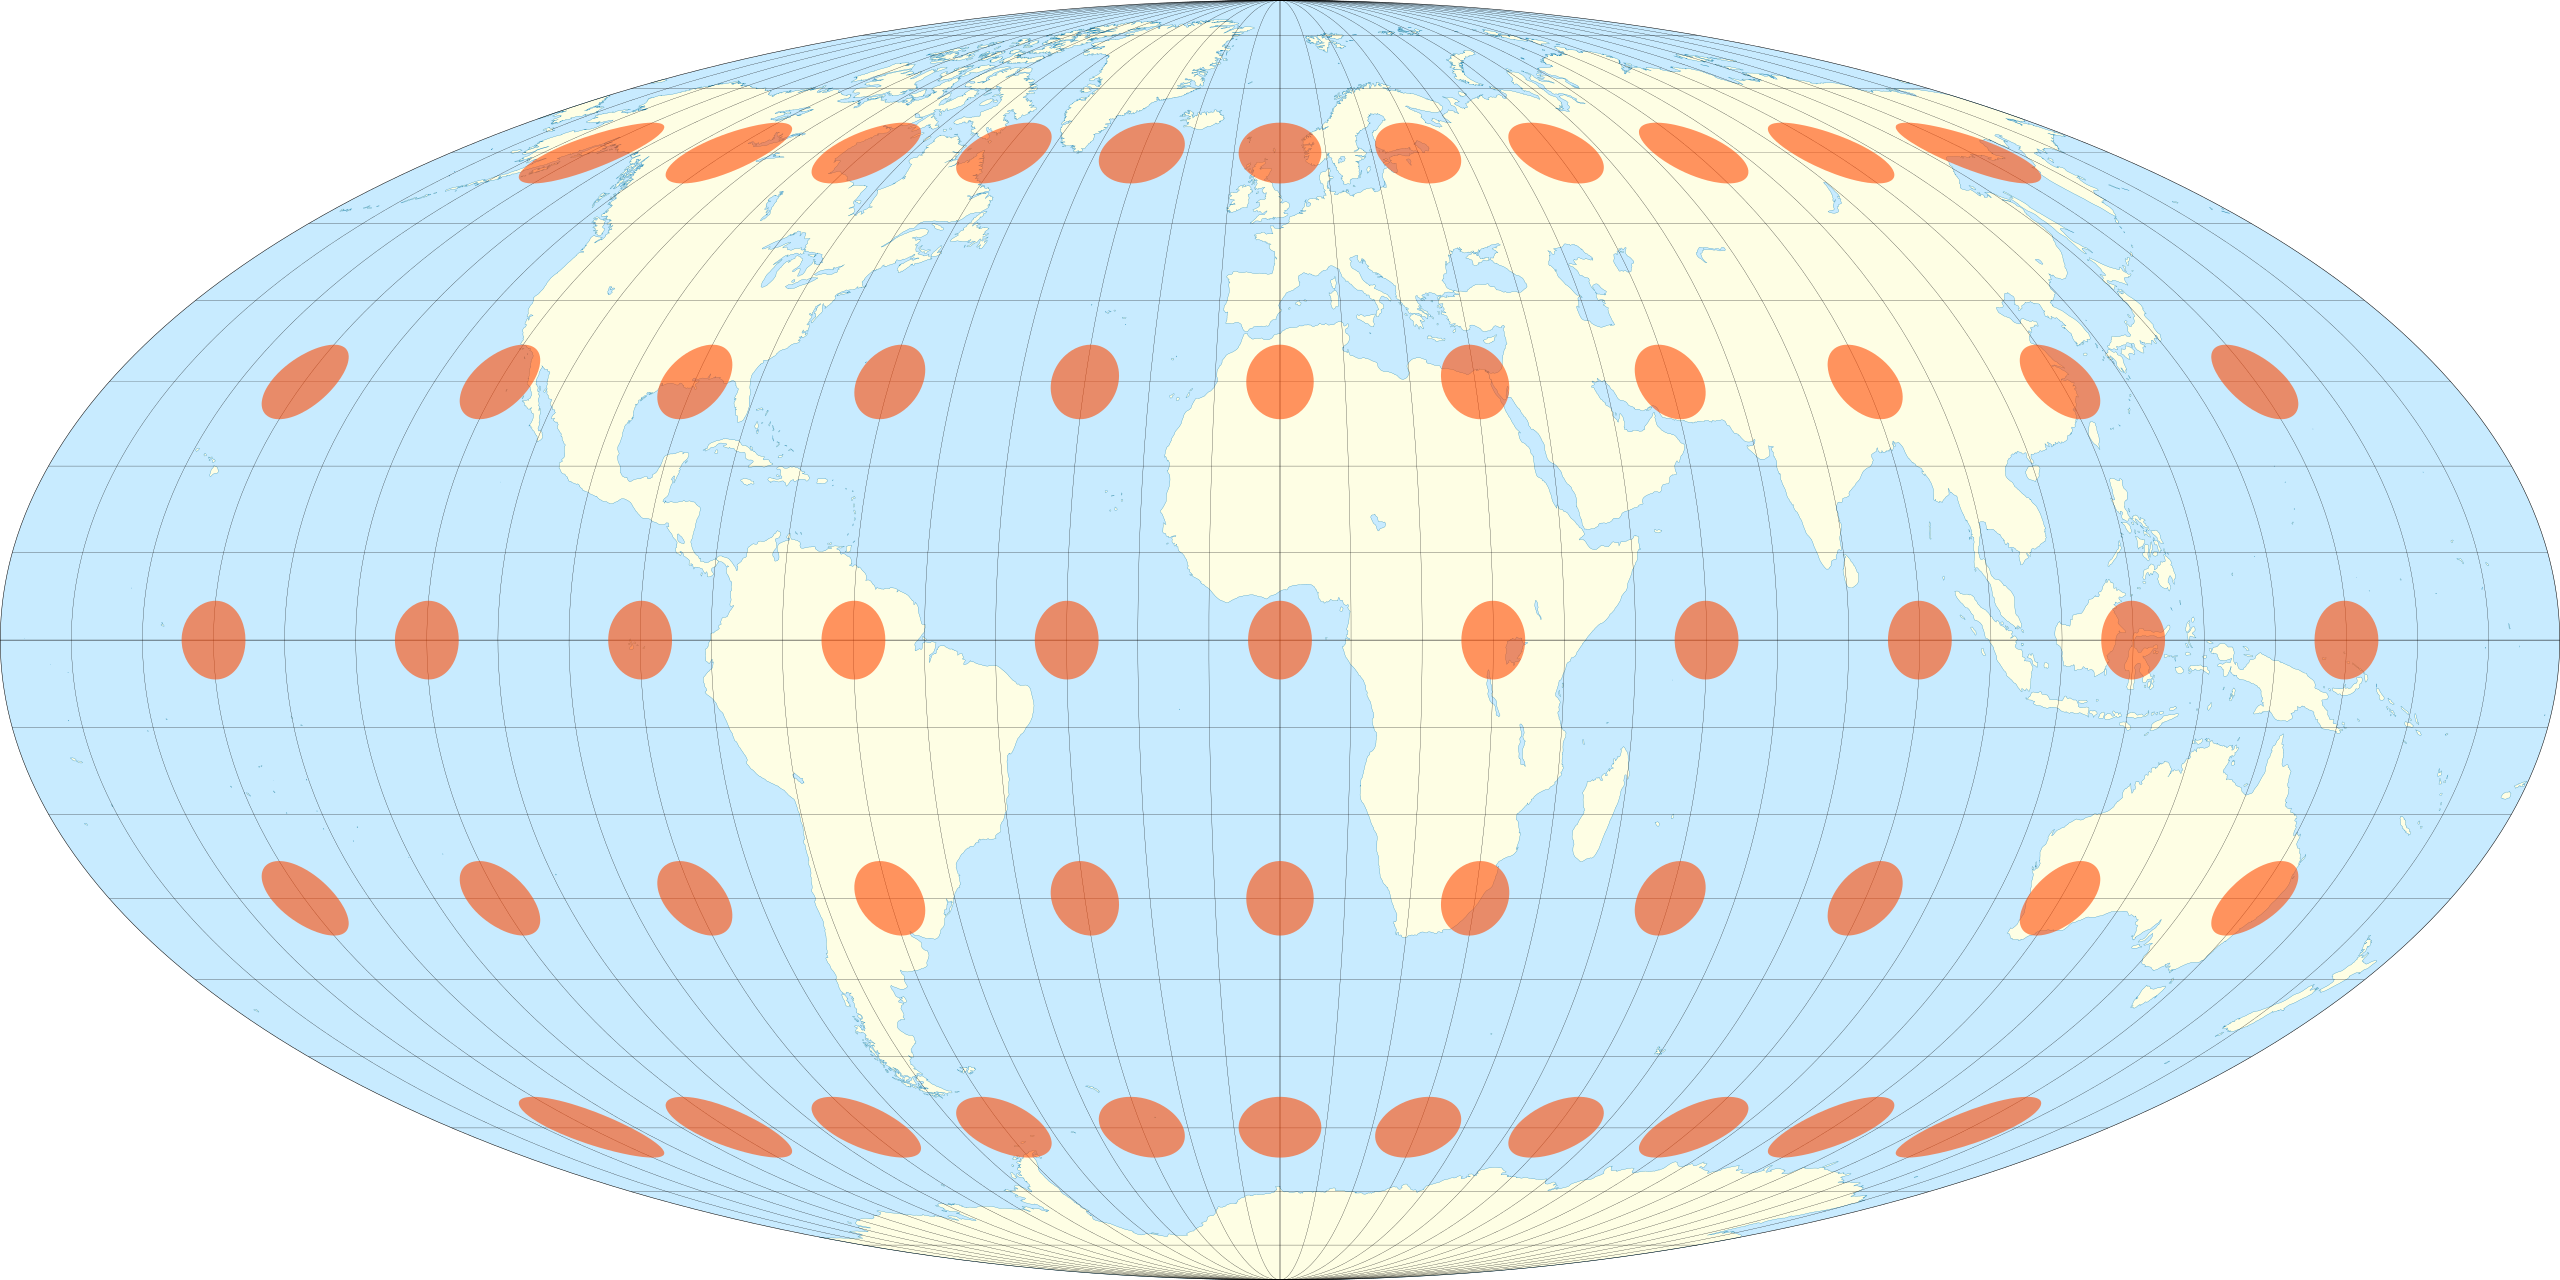
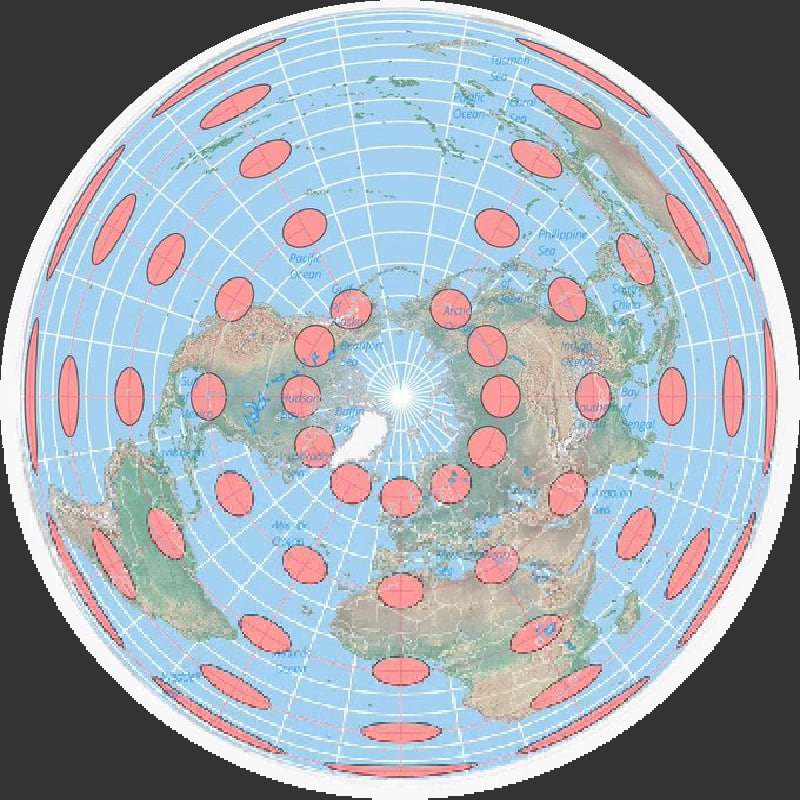
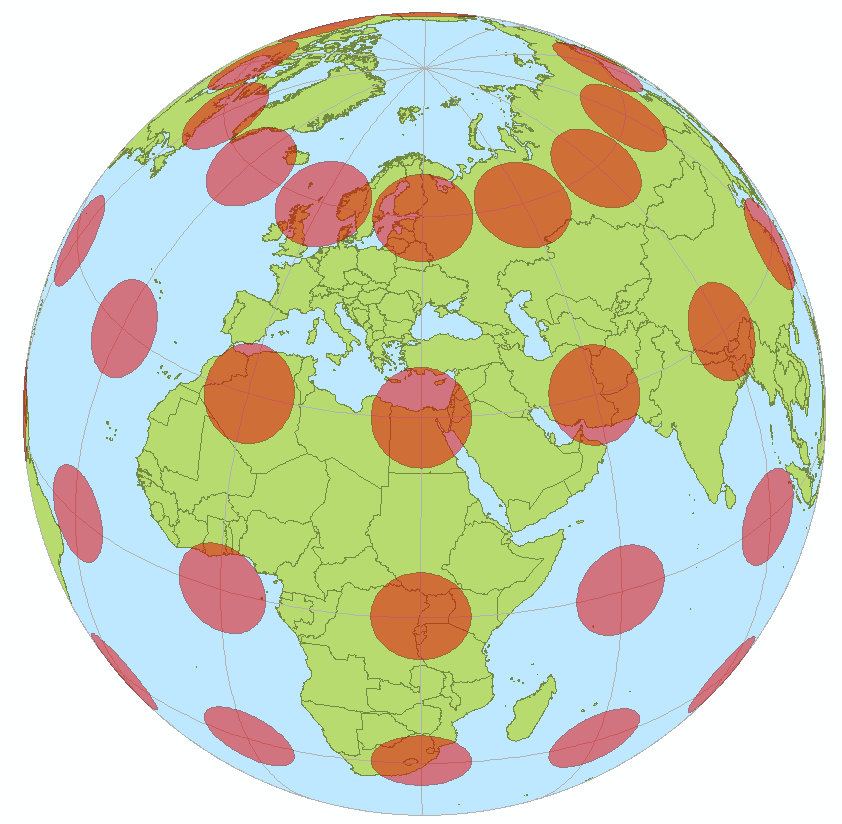
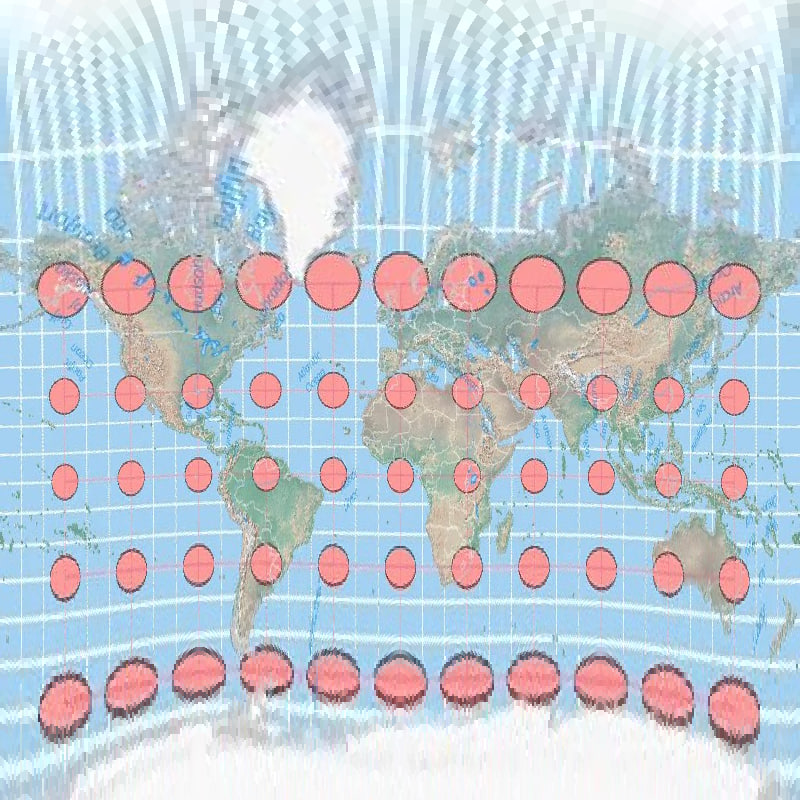
Tissot’s indicatrix was created by a French mathematician named Nicolas Auguste Tissot between 1859-1871. He showed how the geometry of putting an object like a globe onto a map creates an ellipse that has axes indicating two directions along a scale of maximal and minimal points on a map.
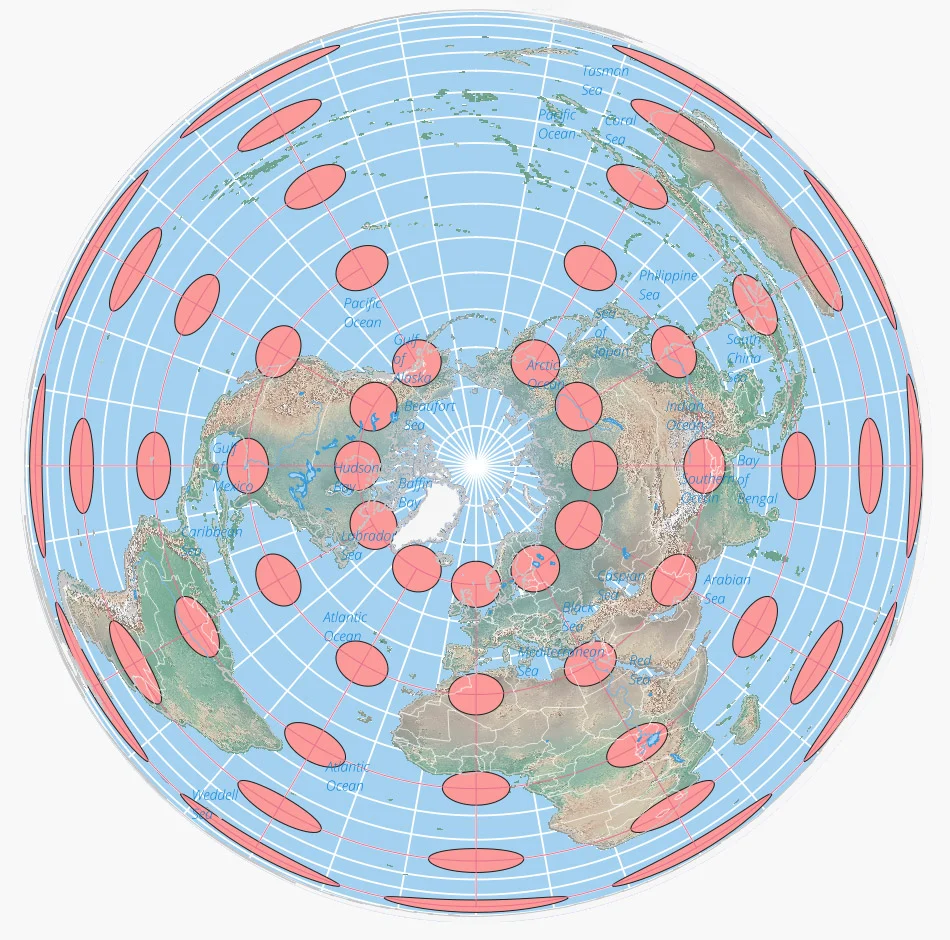
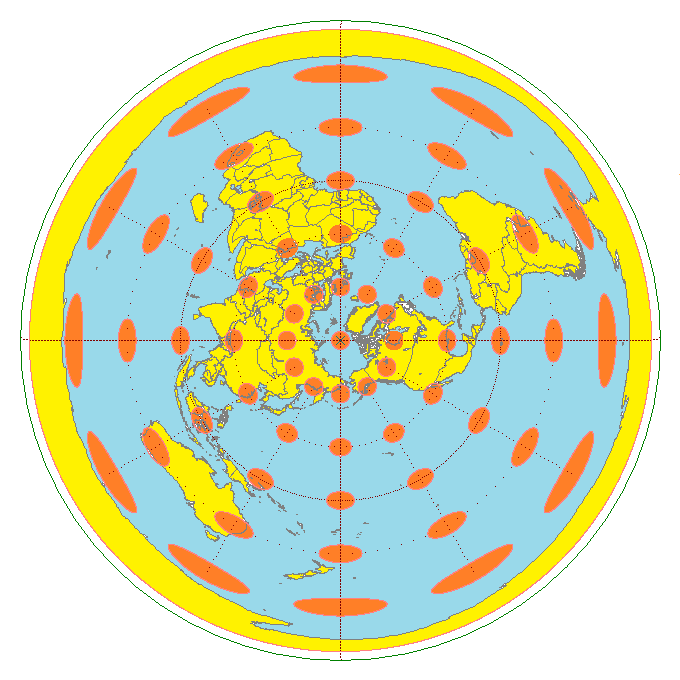
A world map centered on the North Pole in the Lambert Azimuthal equal area map projection. The overlaid Tissot’s indicatrix ellipses shows how distortion is greatest at the edges of the map. Map: Caitlin Dempsey.
[https://en.wikipedia.org/wiki/Tissot's_indicatrix#](https://en.wikipedia.org/wiki/Tissot's_indicatrix#)
[https://en.wikipedia.org/wiki/Tissot's_indicatrix#](https://en.wikipedia.org/wiki/Tissot's_indicatrix#)

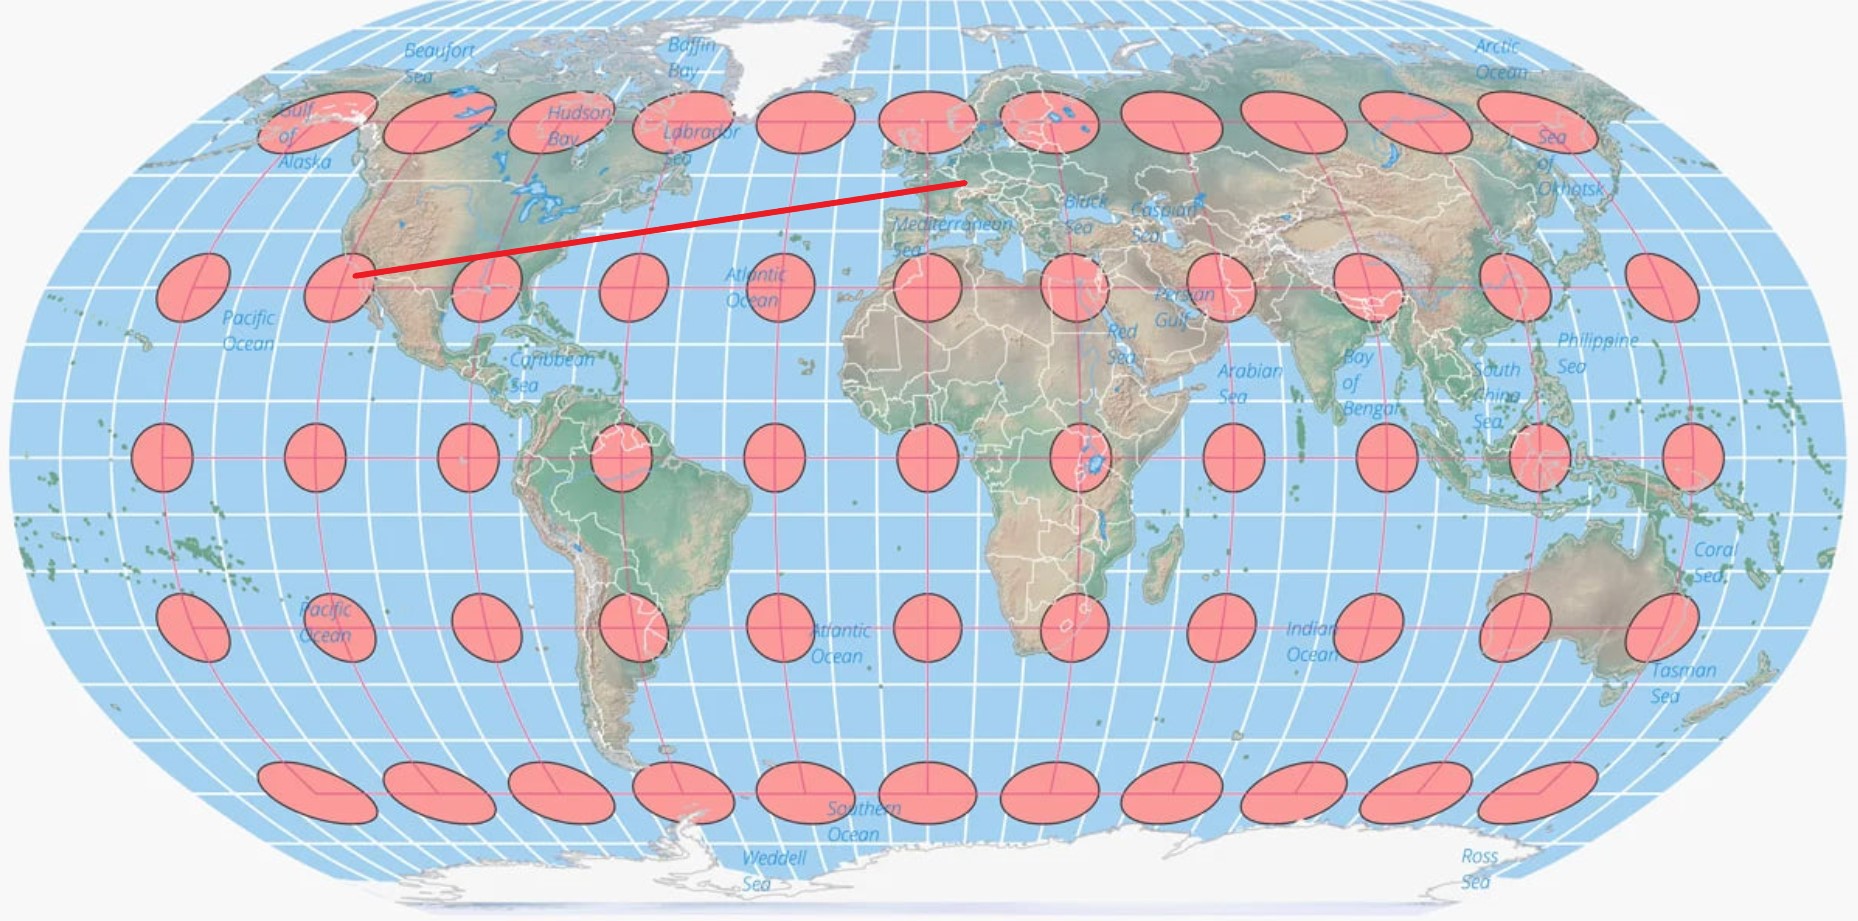
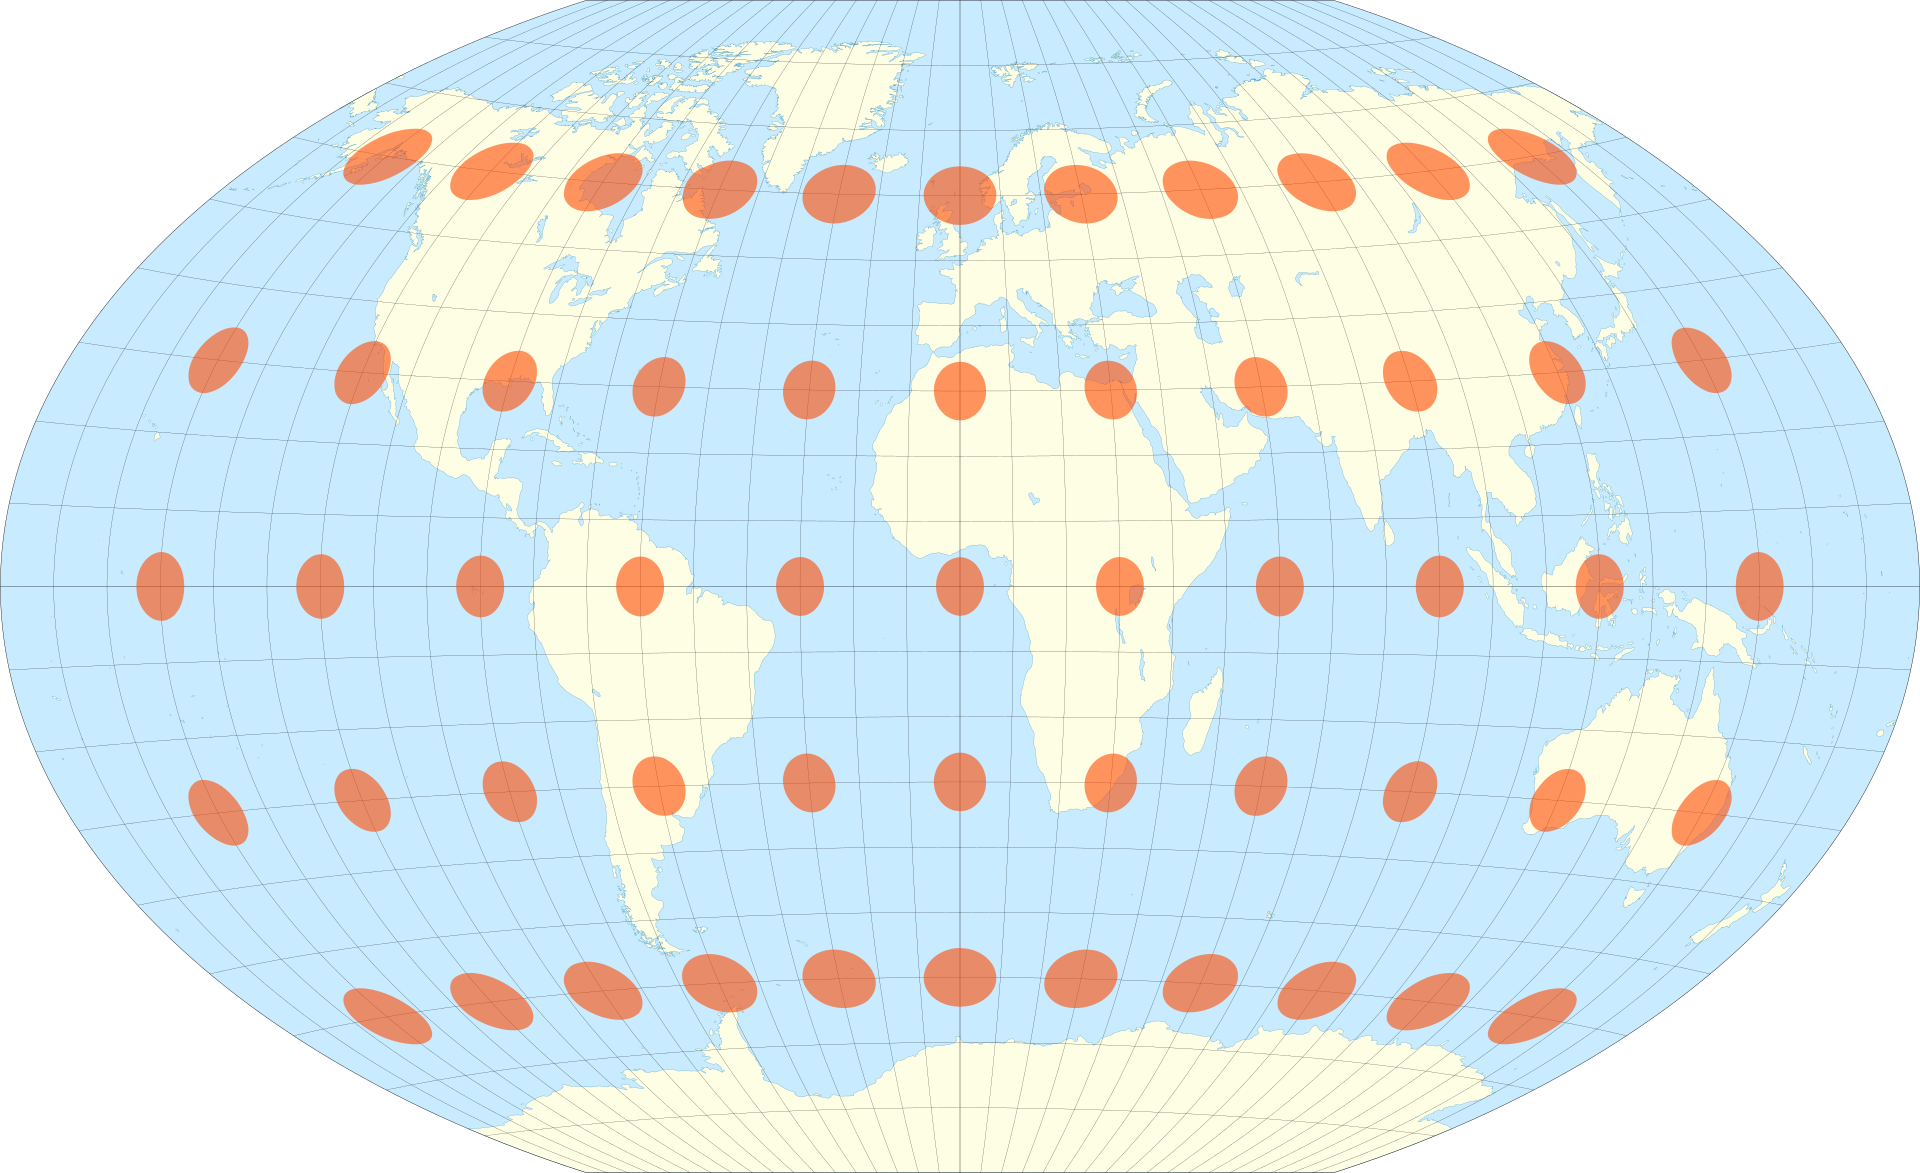
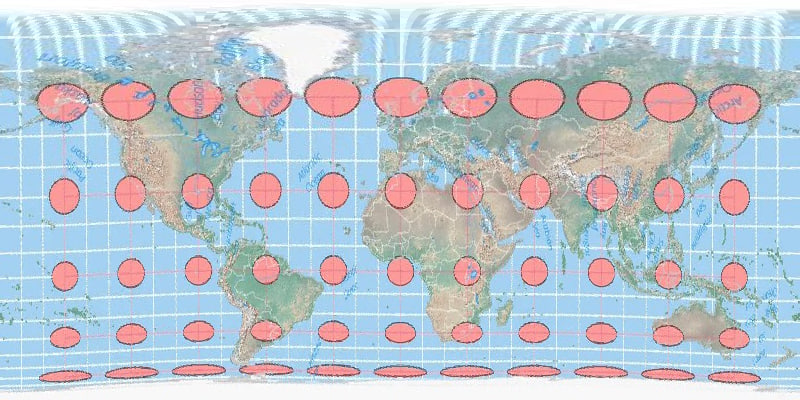
A Tissox matrix overlaid onto a world map using the [Robinson Projection](https://www.geographyrealm.com/robinson-map-projection/). Distortion is more prominent towards the poles as compared to the Equator. Map: Caitlin Dempsey, Natural Earth data.
Tissot found a way to indicate how much a [map’s points were distorted using his scale](https://www.geographyrealm.com/changing-map-scale-pantograph/). Distortion varies across a map, which makes the scale important for knowing what is the most distorted and what is only slightly distorted.
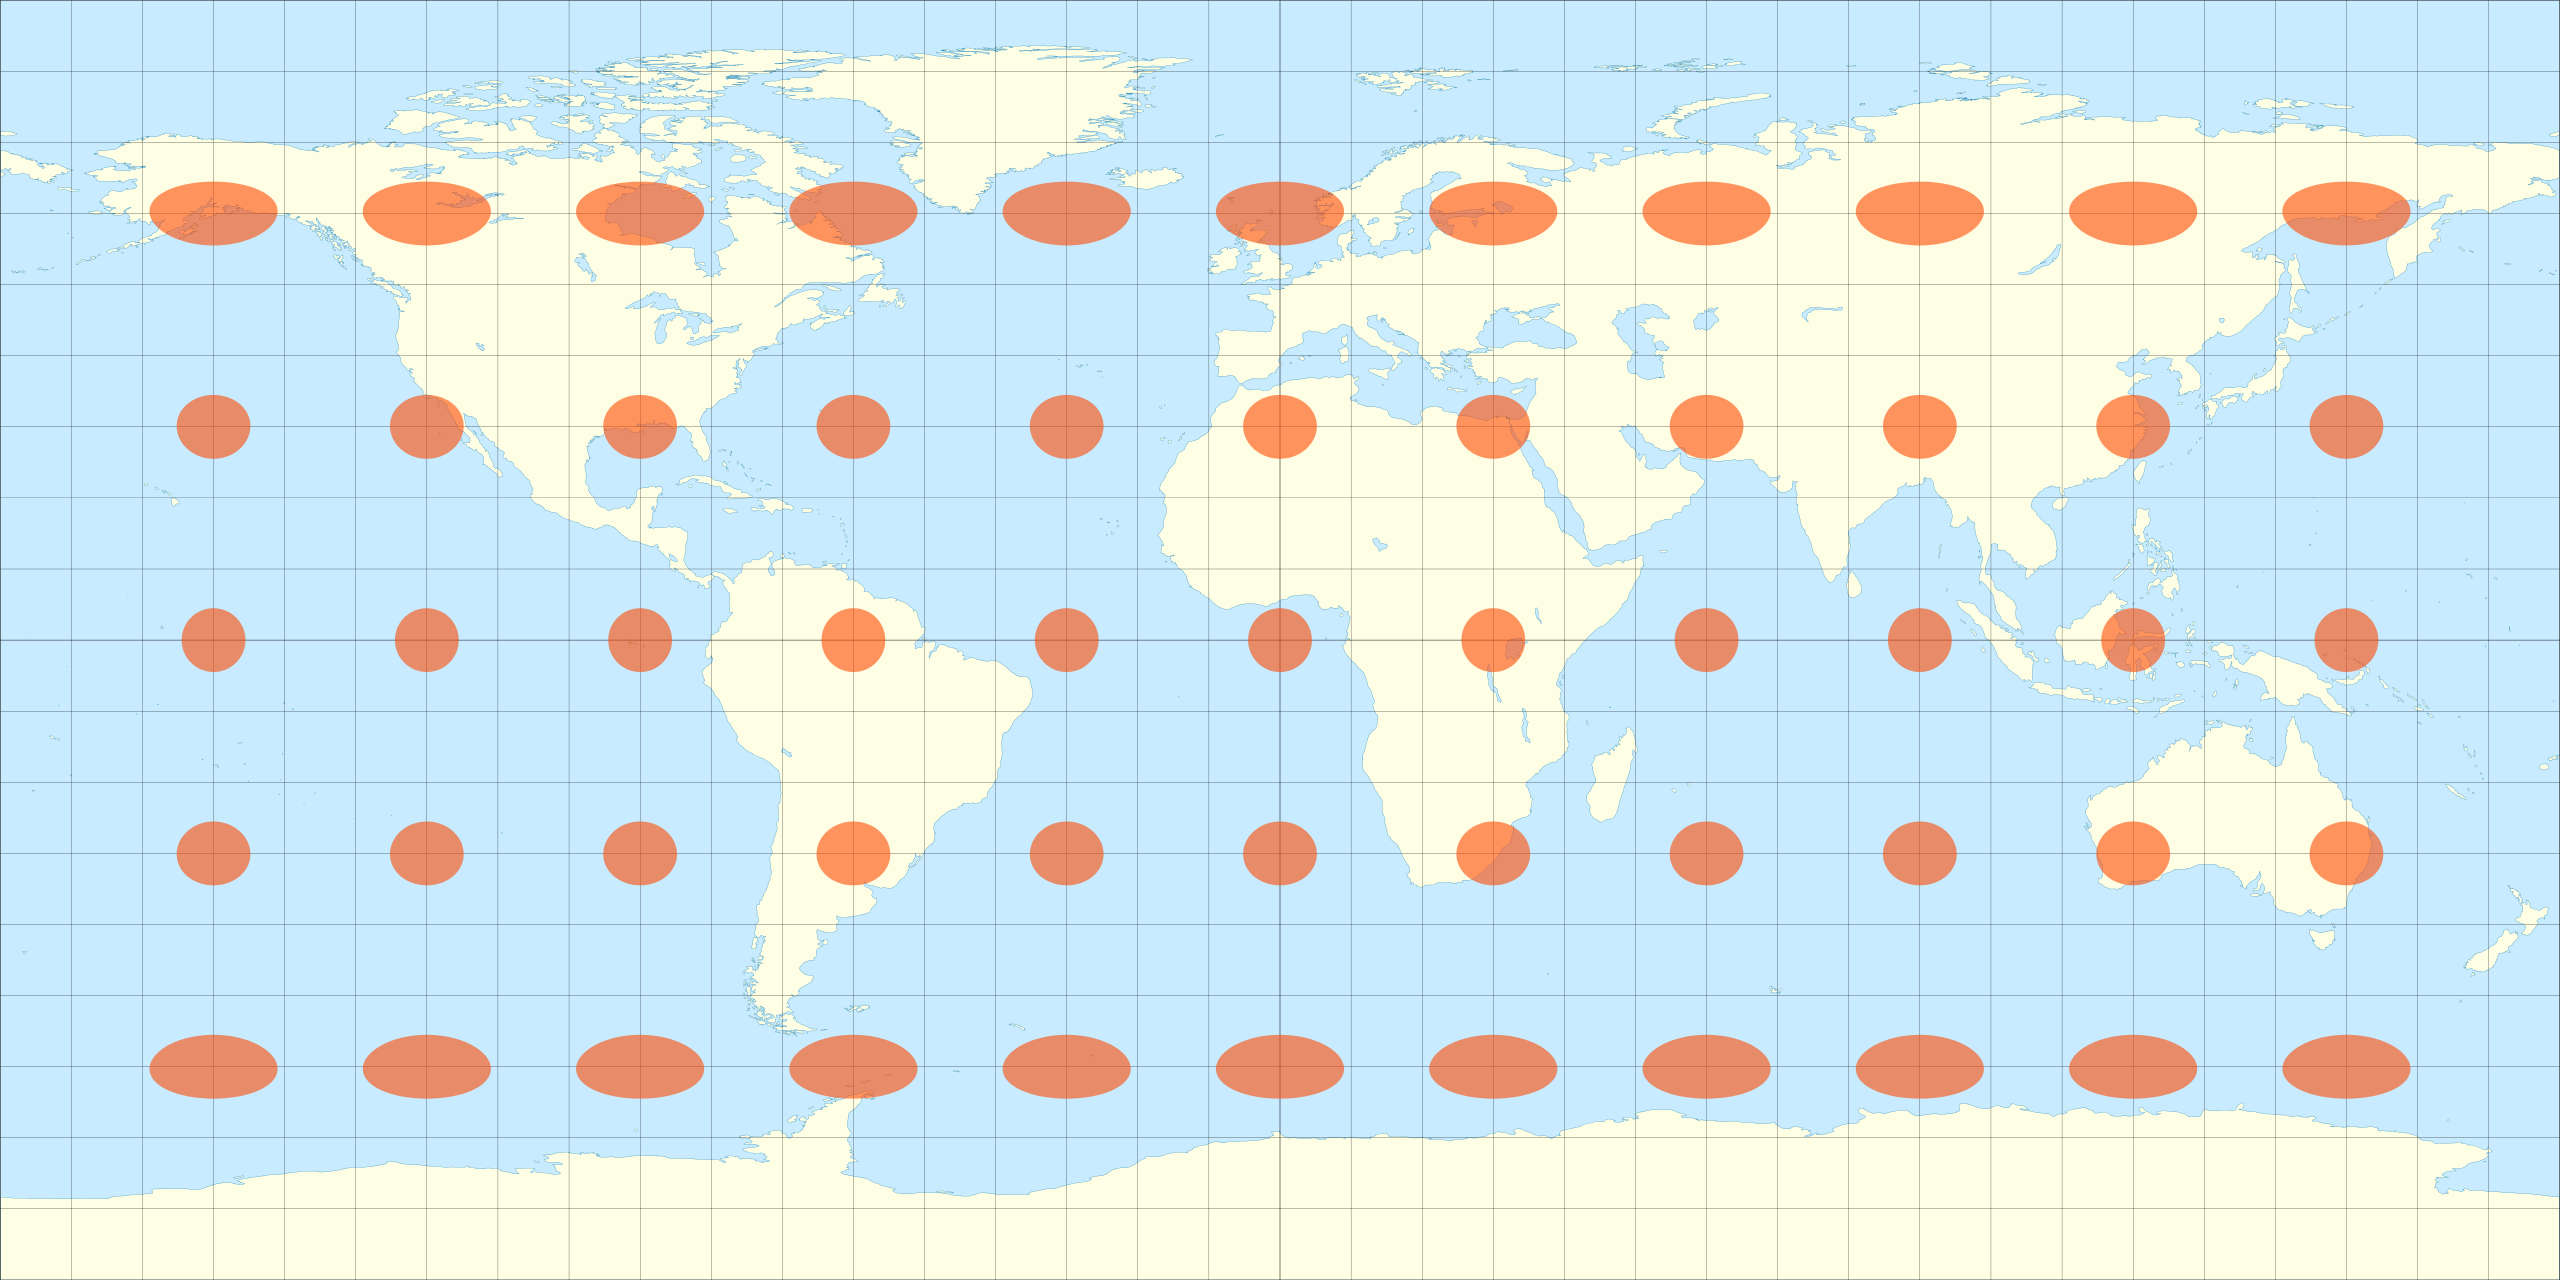
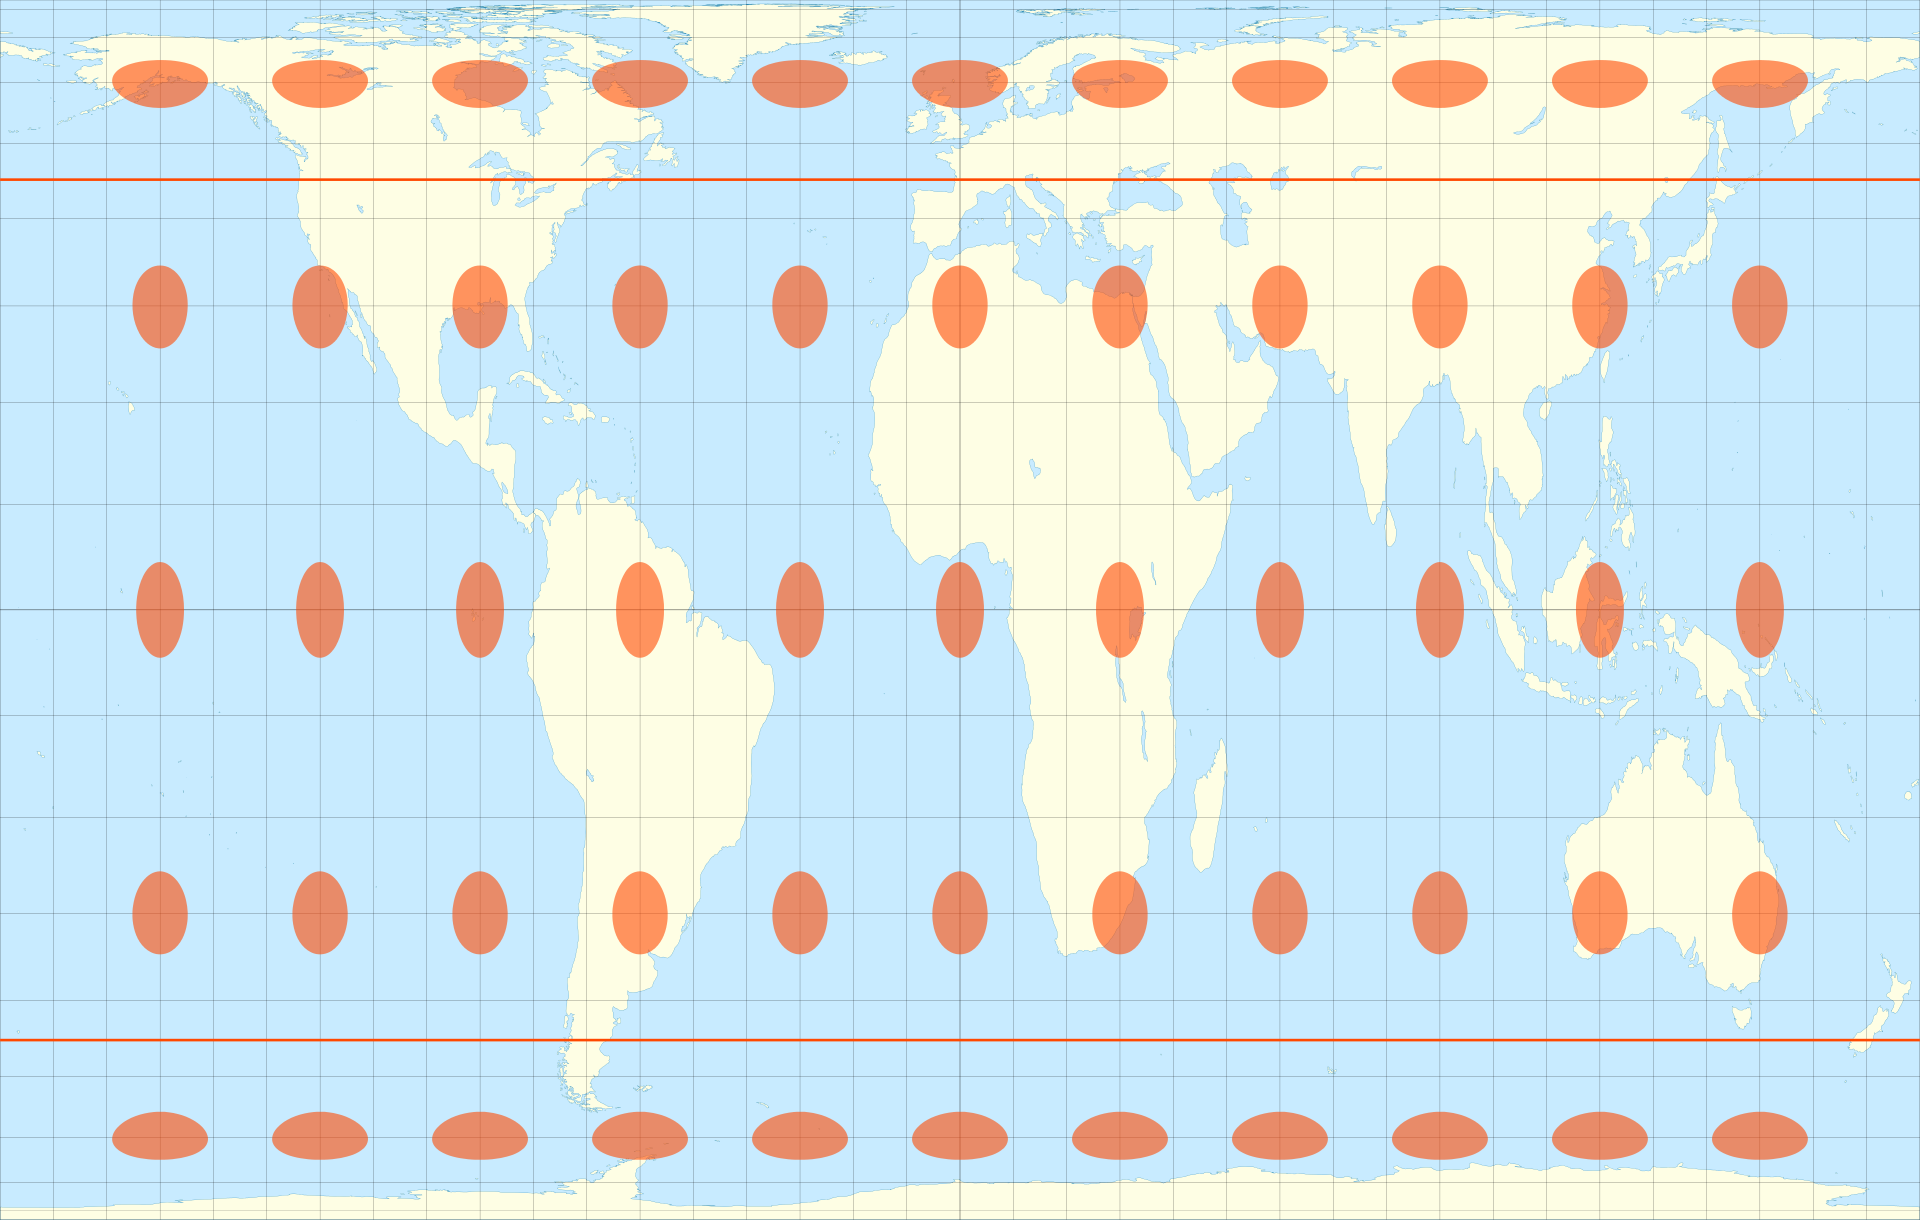
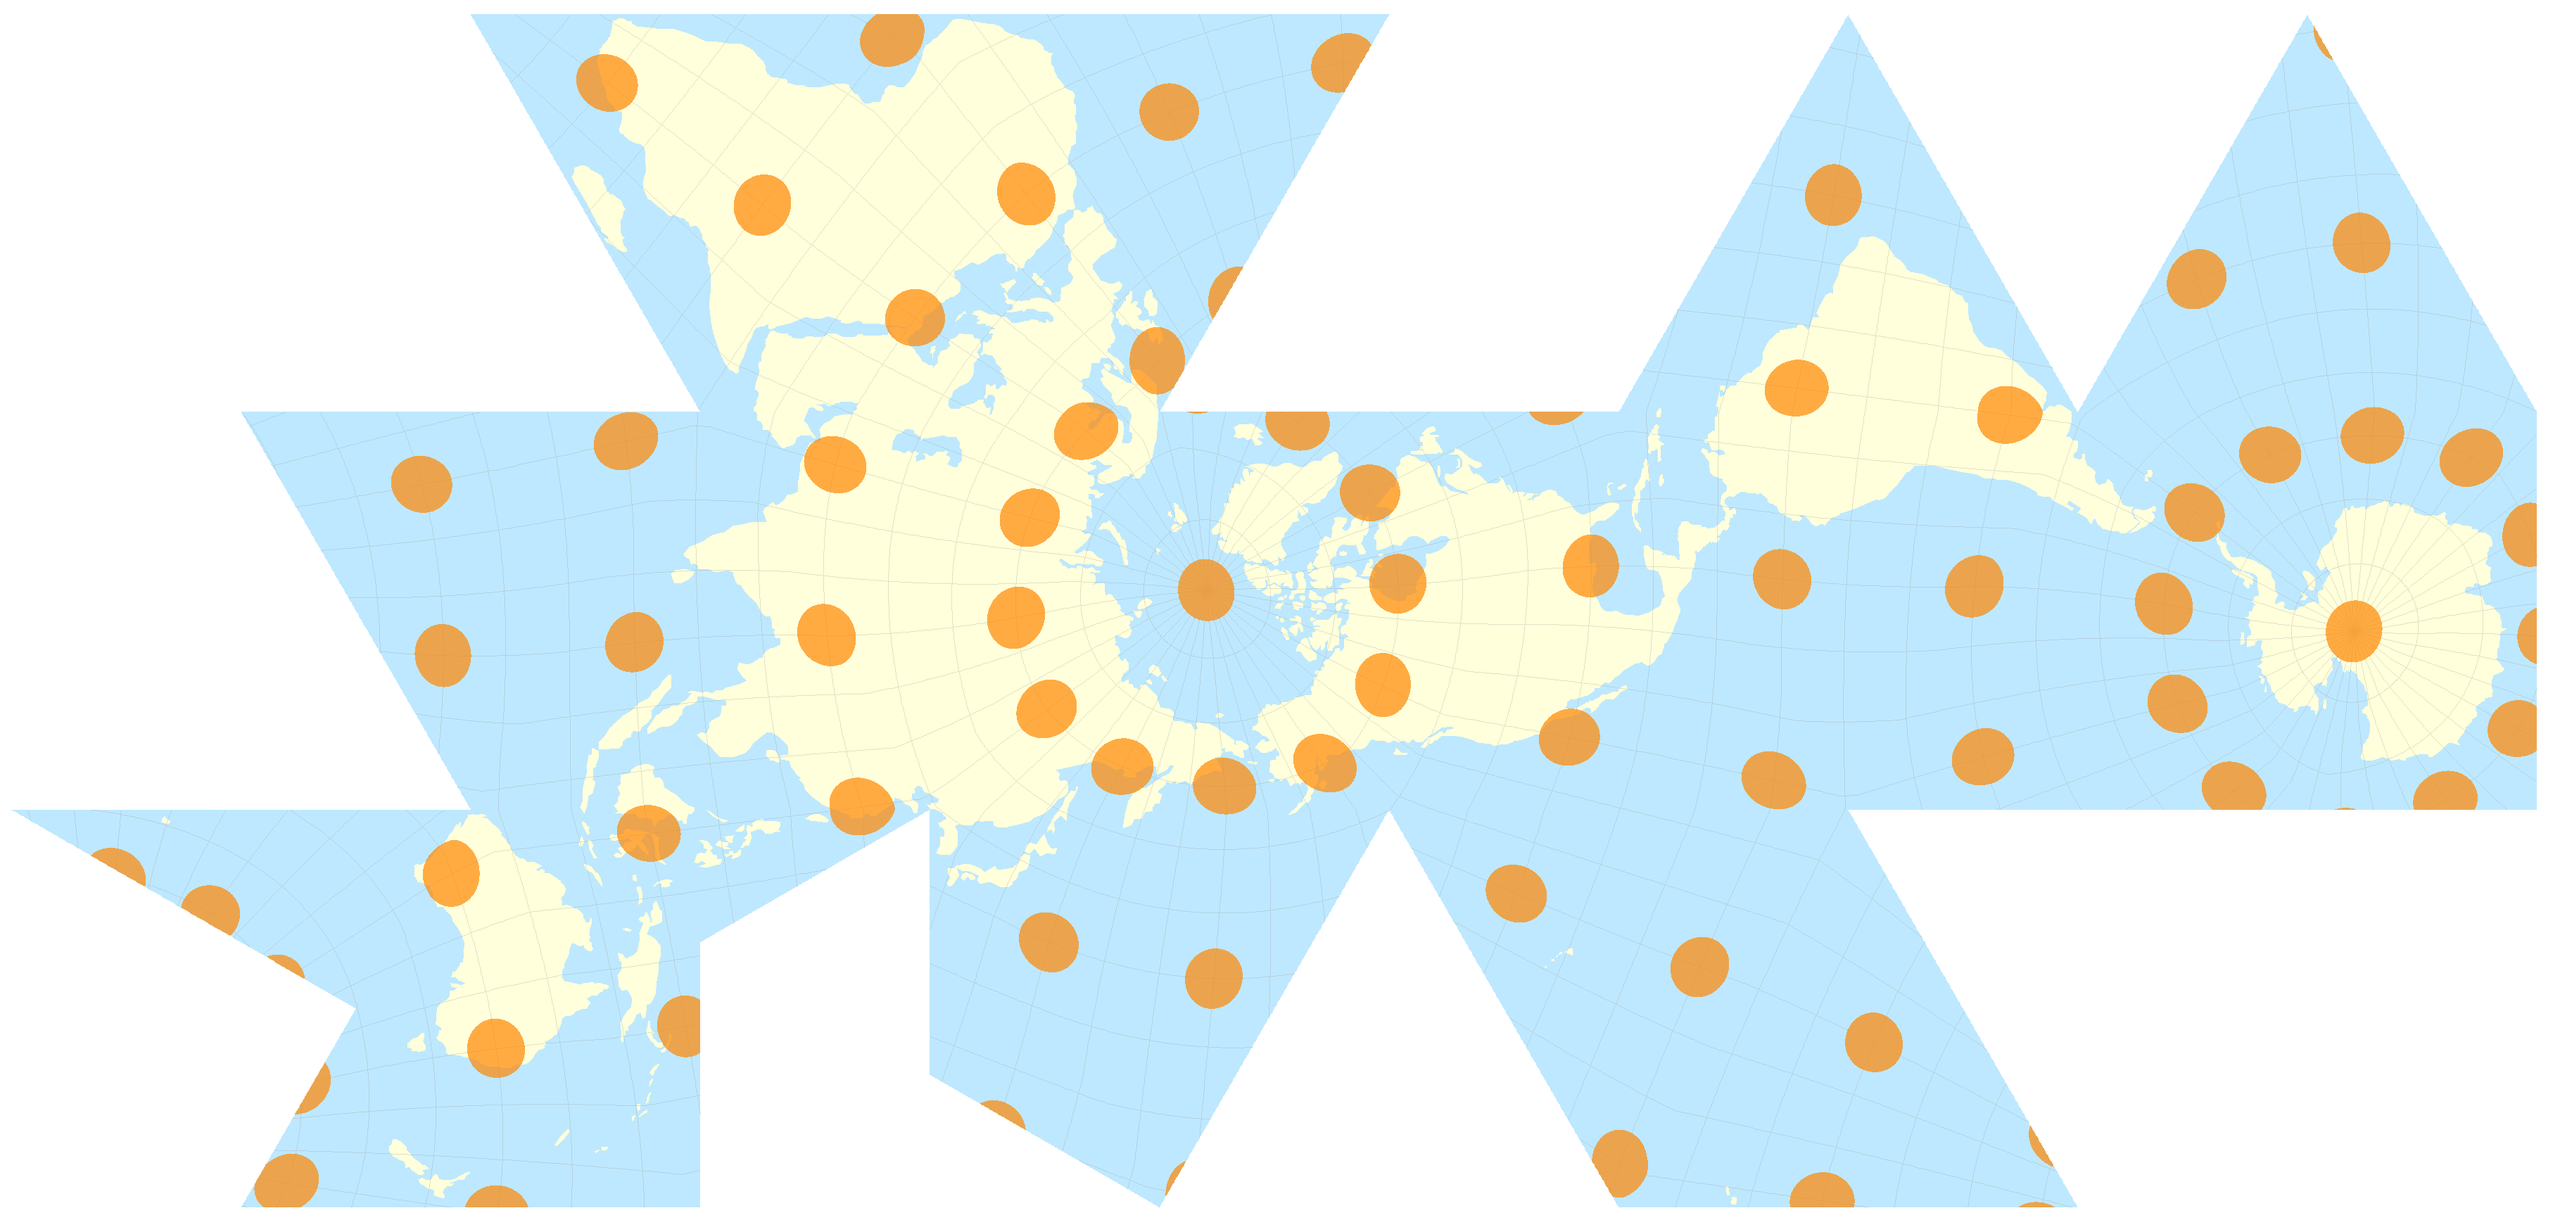
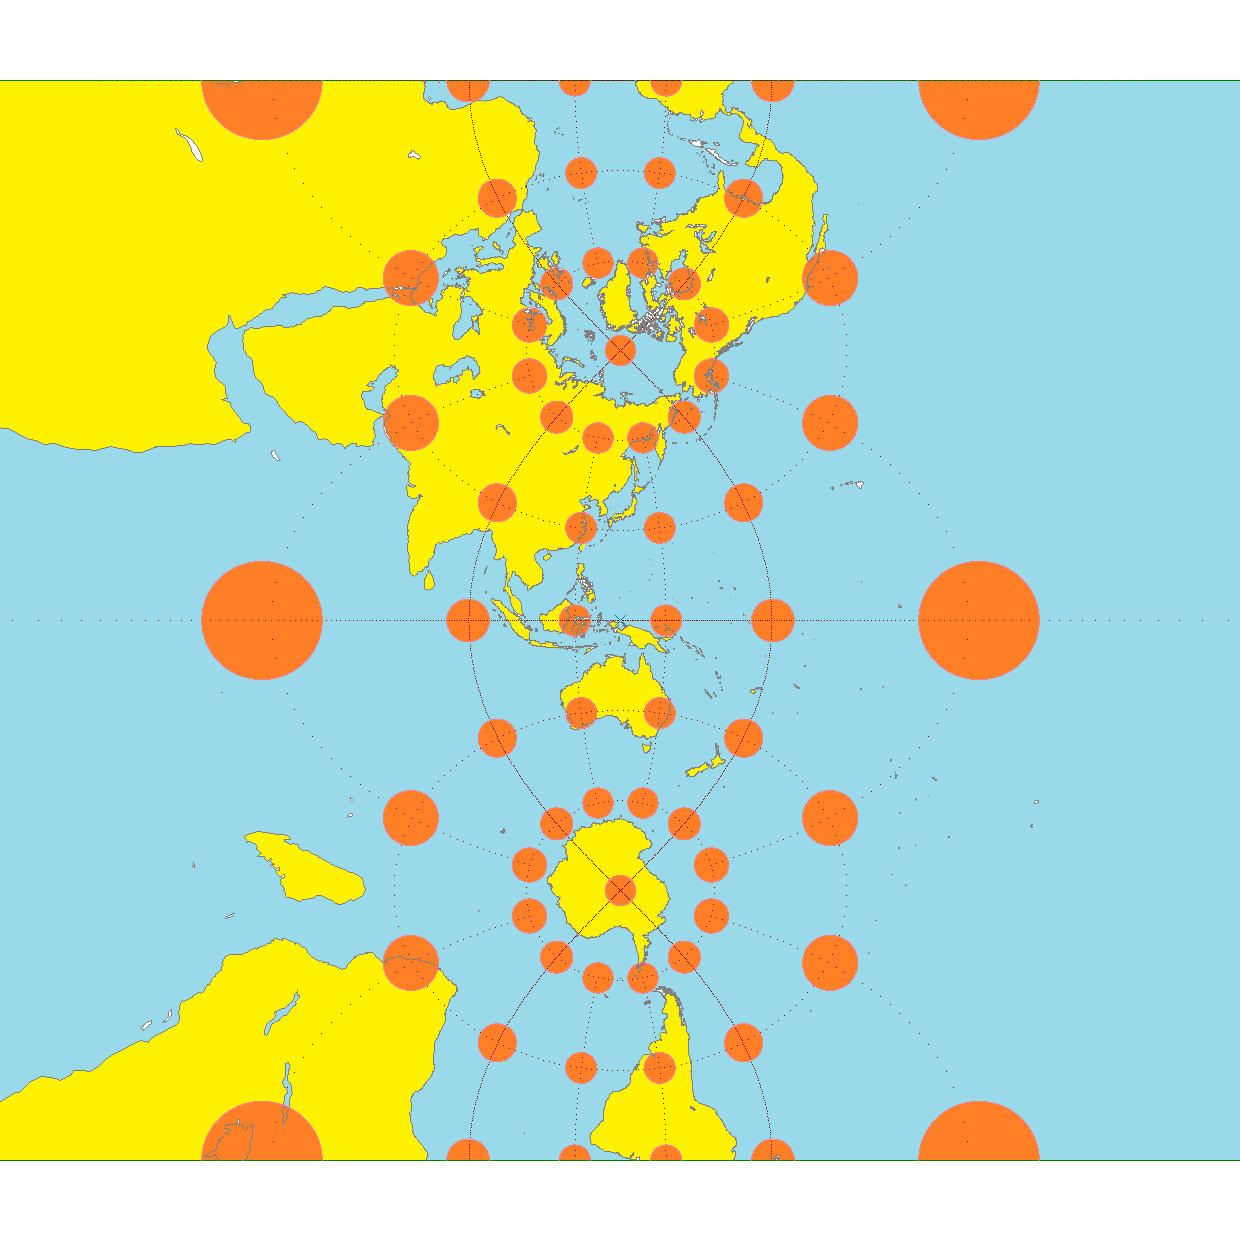
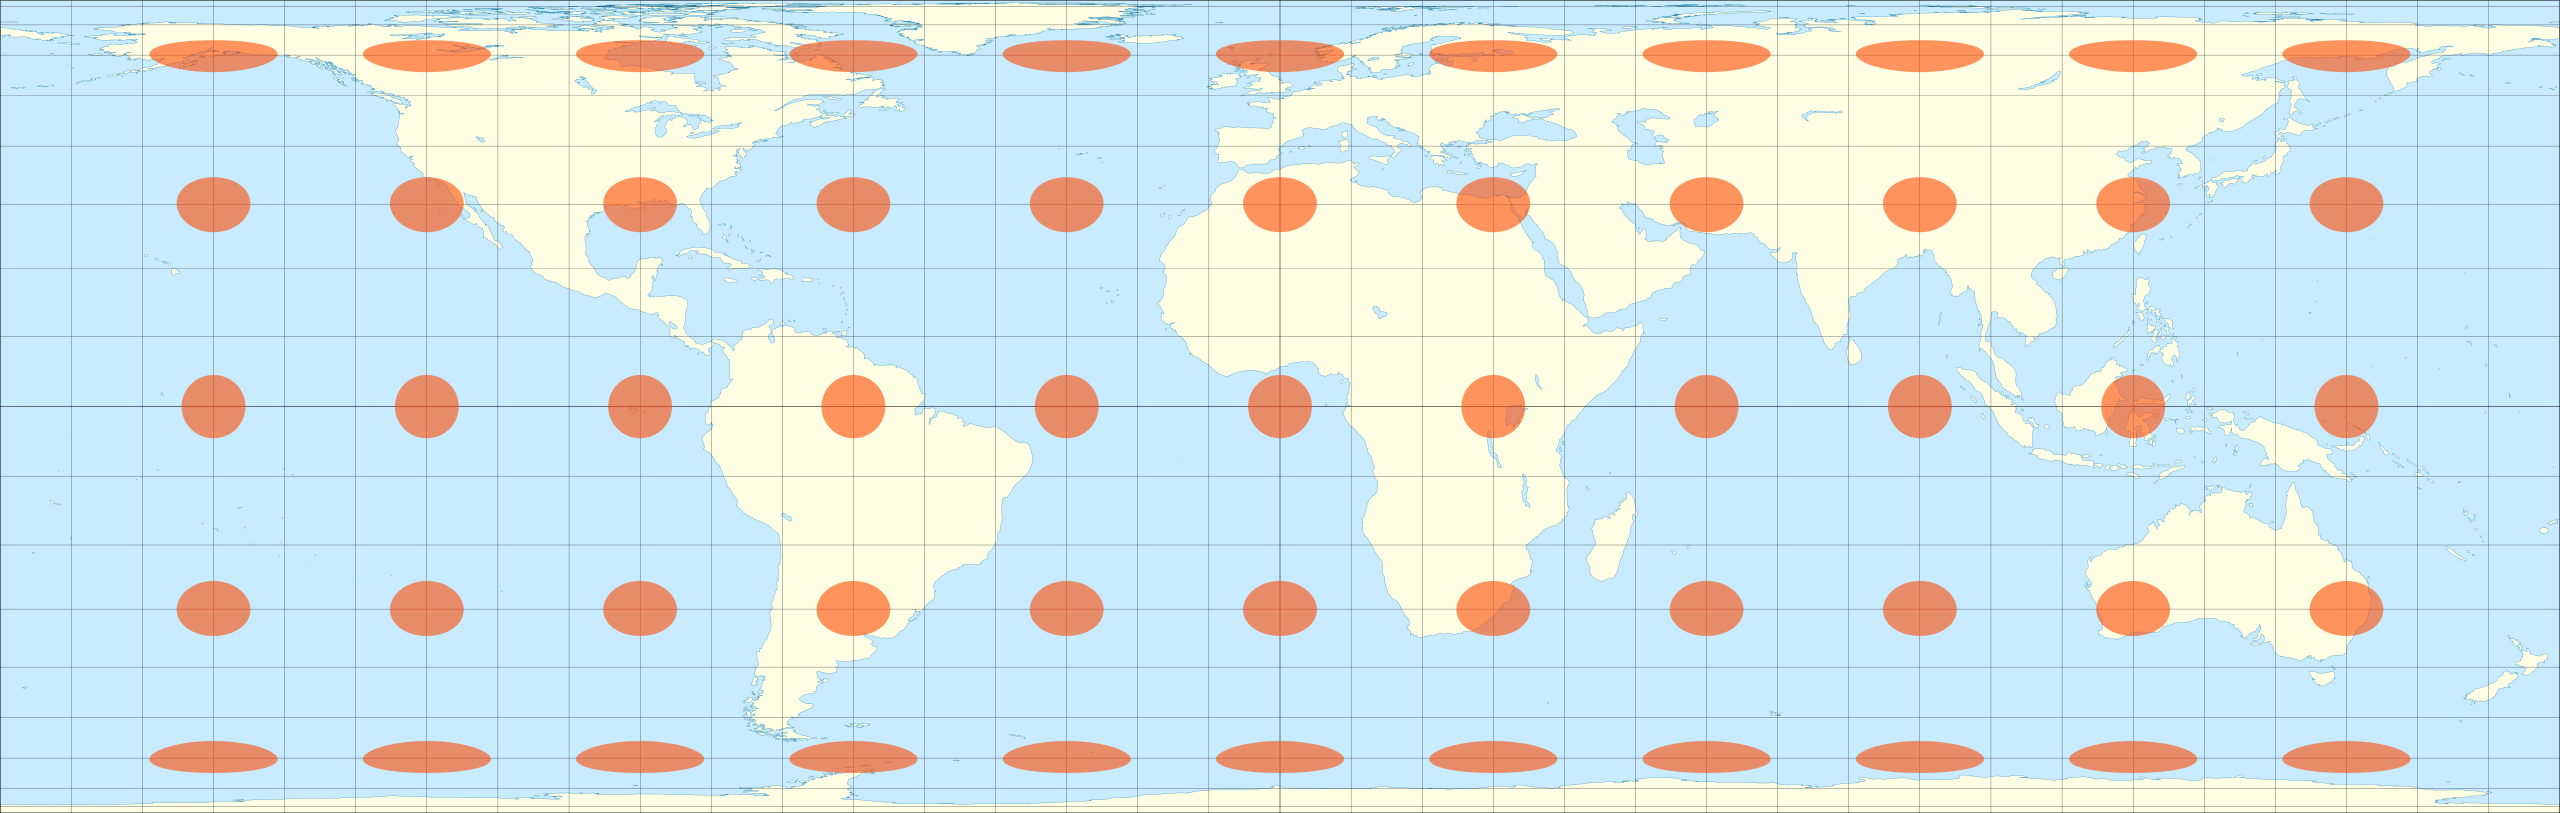
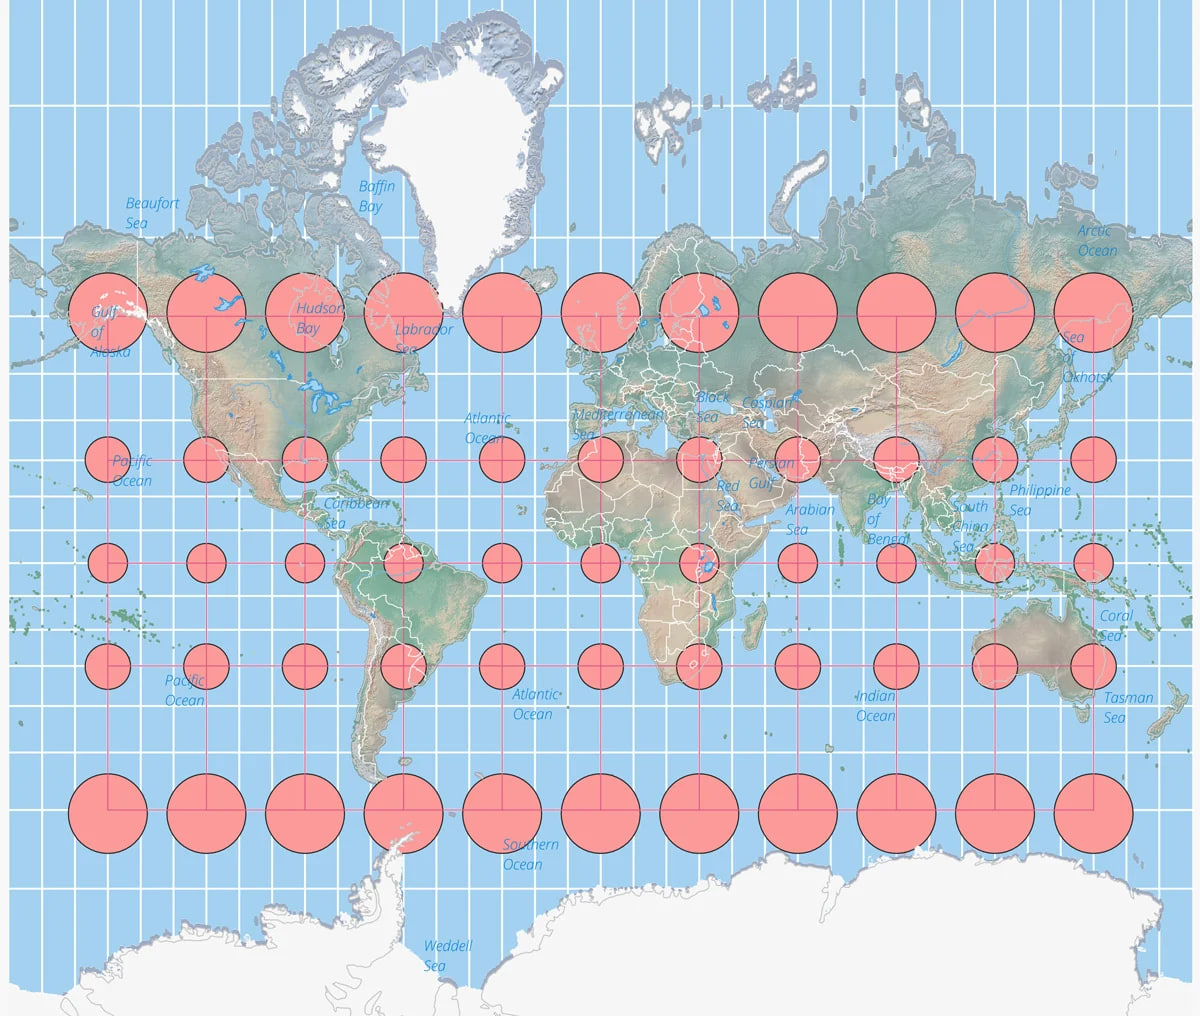
The best way to visualize Tissot’s indicatrix is by overlaying circles on to a map. When Tissot’s indicatrix is applied, the circles are altered in size and/or shape based on how much distortion applies to that part of the map.

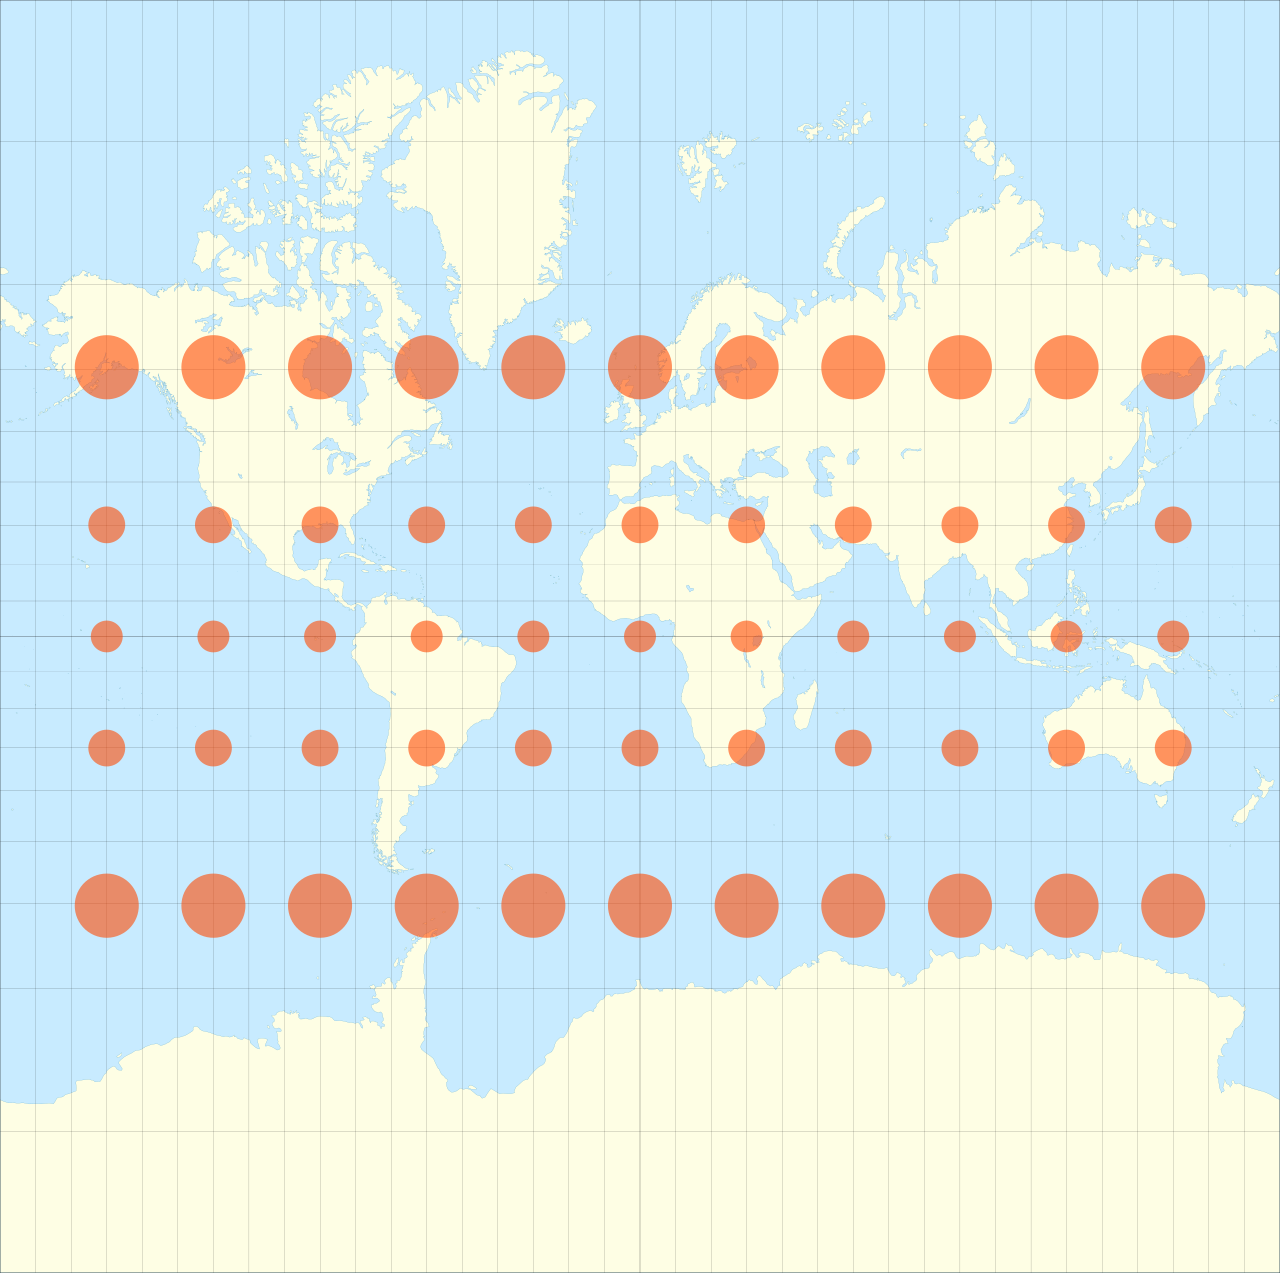
Tissot’s indicatrix for the [Mercator map projection](https://www.geographyrealm.com/look-mercator-projection/). Map: Caitlin Dempsey, Natural Earth data.
Tissot’s indicatrix can be used to understand and visualize the distortions that occur in different map projections. Linear, angular, and areal distortion can be seen, as well as the magnitude of the distortion.
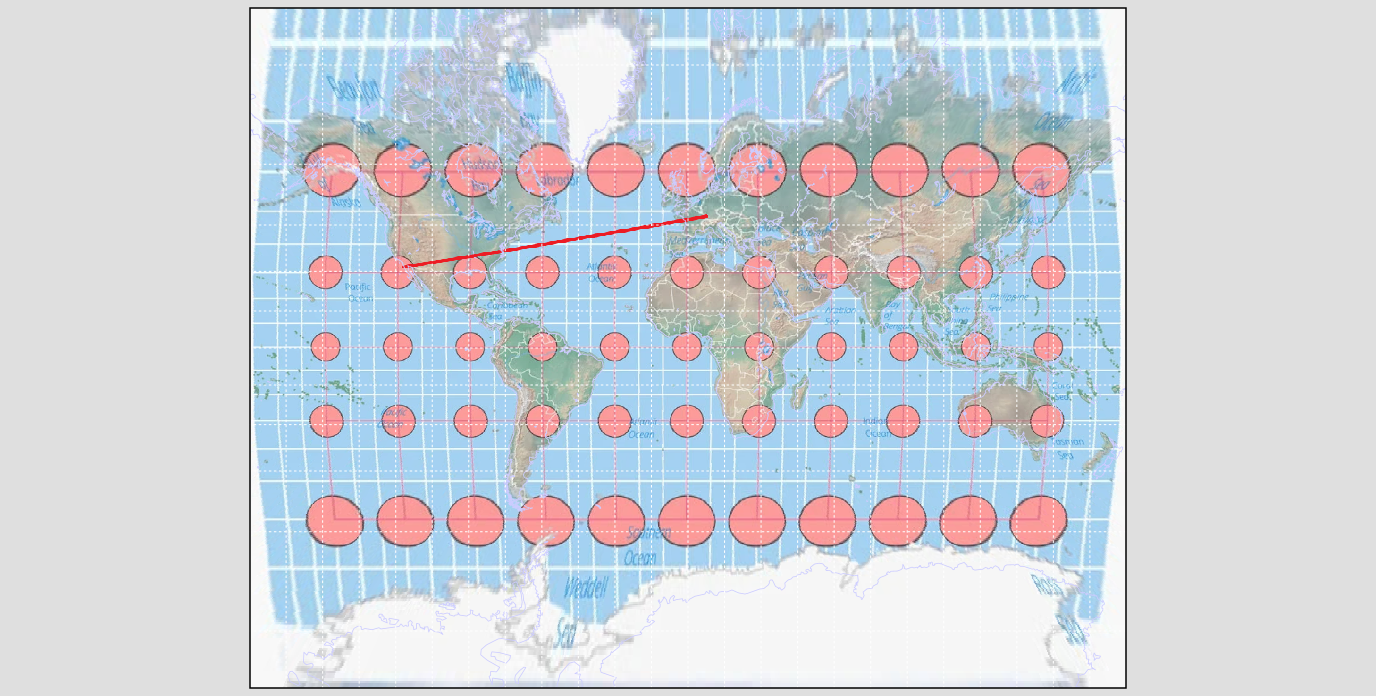
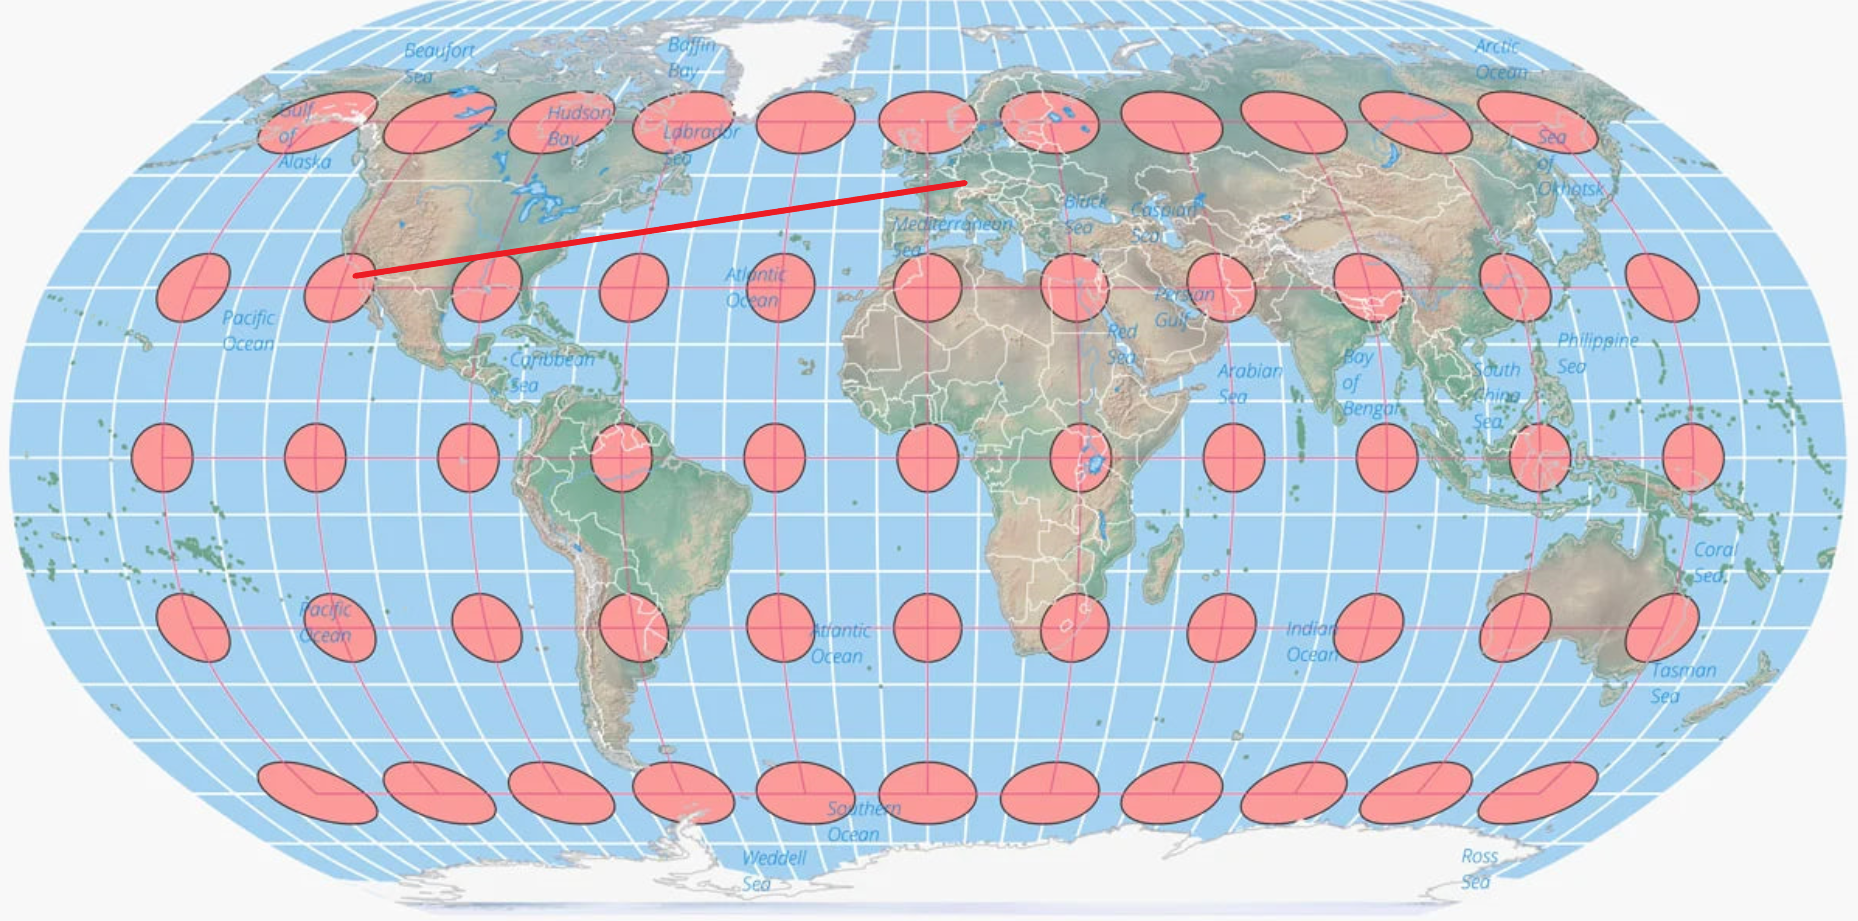


This route
This line represents
plotted and scaled differently :
Brief Mainstream history
[https://www.thoughtco.com/the-history-of-cartography-1435696](https://www.thoughtco.com/the-history-of-cartography-1435696)
## Early Maps and Cartography
Some of the earliest known maps date back to 16,500 BCE and show the night sky rather than the Earth. Ancient cave paintings and rock carvings also depict landscape features like hills and mountains. Archaeologists believe that these paintings were used both to navigate the areas they showed and to portray the areas that people visited.
Some of the earliest known maps date back to around 16,500 BCE and depict the night sky rather than the Earth. These ancient representations show humanity’s early attempts to understand and navigate their environment. Alongside these celestial maps, cave paintings and rock carvings from the same era often illustrate landscape features such as hills and mountains.
### Ancient Maps: Night Sky and Earth
#### Celestial Maps
- **Timeframe**: Circa 16,500 BCE.
- **Content**: These early maps primarily depicted constellations and significant celestial events.
- **Purpose**: They were likely used for navigation, seasonal tracking, and possibly for ceremonial or religious purposes. Understanding the night sky would have been crucial for early humans to navigate, tell time, and predict seasonal changes.
#### Terrestrial Maps
- **Medium**: Cave paintings and rock carvings.
- **Content**: These depicted geographical features such as hills, mountains, rivers, and possibly hunting grounds and migration routes.
- **Purpose**:
- **Navigation**: They provided a visual representation of the landscape, helping people find their way through familiar and unfamiliar terrain.
- **Cultural Record**: They also served as a record of places visited, significant landmarks, and possibly even storytelling through the depiction of events or journeys.
### Archaeological Interpretations
Archaeologists believe that these ancient maps had dual purposes:
1. **Practical Use**: For navigating the areas depicted, offering a guide to geographical features and routes.
2. **Portrayal of Experience**: Depicting the areas people visited, these maps could also communicate important information about the landscape to others in the community or future generations.
### The Role of Ancient Maps in Human Development
The creation and use of these early maps highlight several key aspects of human development:
- **Cognitive Skills**: The ability to abstractly represent the environment indicates advanced cognitive skills, including spatial awareness and memory.
- **Communication**: Maps served as a means of communication, conveying complex information about the environment that could be shared and understood by others.
- **Cultural Significance**: They provided a shared understanding of the world, reinforcing community bonds and cultural identity.
### Conclusion
Ancient maps, whether depicting the night sky or terrestrial features, played a crucial role in the early development of human navigation and cultural expression. They illustrate the deep connection early humans had with their environment and their sophisticated ability to represent and communicate complex spatial information. These early maps are a testament to humanity’s enduring quest to understand and navigate the world around us.
Maps were created in ancient Babylonia (mostly on clay tablets), and it is believed that they were drawn with very accurate surveying techniques. These maps showed topographical features like hills and valleys but also had labeled features. The Babylonian World Map, created in 600 BCE, is considered to be the earliest map of the world. It is unique because it is a symbolic representation of the Earth.
According to mainstream**
### Why Early Maps Were Star Maps and Their Usefulness
#### Why Early Maps Depicted Stars:
1. **Navigation and Orientation**:
- **Celestial Navigation**: Early humans relied on the night sky for navigation. Stars, especially those in prominent constellations, provided a consistent frame of reference. Unlike landmarks on Earth, stars appeared in predictable patterns and movements, making them reliable guides.
- **Orientation**: Knowing the positions of stars helped early humans orient themselves in their environment, determining directions (north, south, east, west) even in the absence of terrestrial landmarks.
2. **Timekeeping and Calendar Systems**:
- **Seasonal Changes**: Observing the stars allowed early humans to track the changing seasons. Specific stars and constellations appear at different times of the year, marking important seasonal changes crucial for agricultural activities, hunting, and gathering.
- **Lunar and Solar Cycles**: Early maps could also track the phases of the moon and the sun's path across the sky, helping to establish early calendar systems.
3. **Cultural and Religious Significance**:
- **Mythology and Storytelling**: Many ancient cultures developed myths and stories around constellations. Mapping the stars allowed these stories to be recorded and passed down through generations.
- **Ceremonial Practices**: The alignment of stars and celestial events often had significant religious and ceremonial implications. Early star maps could help schedule and orient rituals and ceremonies.
#### Usefulness of Star Maps to Early Humans:
1. **Reliable Navigation**:
- **Consistent Reference Points**: Stars provided a reliable means to navigate long distances, especially in environments without prominent landmarks, such as deserts and oceans.
- **Travel and Trade**: For early travelers and traders, knowing the stars was essential for night travel and ensuring they stayed on course.
2. **Agricultural Planning**:
- **Seasonal Timing**: By knowing when certain stars or constellations appeared, early humans could plan agricultural activities like planting and harvesting, which were aligned with seasonal cycles.
3. **Safety and Survival**:
- **Nighttime Orientation**: The ability to navigate at night increased safety and survival chances, especially for nomadic tribes or those migrating over long distances.
- **Resource Location**: Stars helped in locating water sources, grazing grounds, and other critical resources by providing directional guidance.
4. **Cultural Identity and Knowledge Preservation**:
- **Recording Knowledge**: Star maps served as a means to record and preserve astronomical knowledge and cultural stories, ensuring they were passed down through generations.
- **Shared Understanding**: These maps fostered a shared understanding of the cosmos and the world, reinforcing community bonds and cultural identity.
### The Greeks: First Paper Maps
Ancient Greeks created the earliest paper maps that were used for navigation, and to depict certain areas of the Earth. Anaximander was the first of the ancient Greeks to draw a map of the known world, and, as such, he is considered to be one of the first cartographers. Hecataeus, Herodotus, [Eratosthenes](https://www.thoughtco.com/eratosthenes-biography-1435011), and [Ptolemy](https://www.thoughtco.com/ptolemy-biography-1435025) were other well-known Greek map makers. The maps they drew were based on explorer observations and mathematical calculations.
The ancient Greek maps are important to the history of cartography because they often showed Greece as being at the center of the world and surrounded by an ocean. Other early Greek maps show the world as divided into two continents—Asia and Europe. These ideas came largely out of [Homer’s](https://www.thoughtco.com/the-life-and-work-of-homer-119091) works as well as other early Greek literature.
### Latitude and Longitude
Many Greek philosophers considered the Earth to be spherical, and this knowledge influenced their cartography. Ptolemy, for instance, created maps by using a coordinate system with parallels of latitude and meridians of longitude to accurately show areas of the Earth as he knew it. This system became the basis for today’s maps, and his atlas "Geographia" is considered to be an early example of modern cartography.
In addition to the ancient Greek maps, early examples of cartography also come out of China. These maps date to the fourth century BCE and were drawn on wooden blocks or produced on silk. Early Chinese maps from the [Qin State](https://www.thoughtco.com/how-qin-dynasty-unified-ancient-china-117672) show various territories with landscape features such as the Jialing River system as well as roads. These are considered some of the world’s oldest economic maps.
### China Furthers Cartography
Cartography continued to develop in China throughout its various dynasties, and in 605 CE an early map using a grid system was created by Pei Ju of the Sui Dynasty. In 801 CE, the "Hai Nei Hua Yi Tu" (Map of Both Chinese and Barbarian Peoples Within the [Four] Seas) was created by the Tang Dynasty to show China as well as its Central Asian colonies. The map was 30 feet (9.1 meters) by 33 feet (10 meters) and used a grid system with a highly accurate scale.
### Atlas Produced
In 1579, the Guang Yutu atlas was produced; it contained over 40 maps that used a grid system and showed major landmarks like roads and mountains as well as the borders of different political areas. Chinese maps from the 16th and 17th centuries continued to develop in sophistication and clearly showed regions that were newly being explored. By the middle of the 20th century, China developed an Institute of Geography that was responsible for official cartography. It emphasized fieldwork in the production of maps focused on physical and economic geography.
## European Cartography
European early medieval maps were mainly symbolic, similar to those that came out of Greece. Beginning in the 13th century, the Majorcan Cartographic School was developed. This "school" was a collaboration of mostly Jewish cartographers, cosmographers, navigators, and navigational instrument-makers. The Majorcan Cartographic School invented the Normal Portolan Chart—a nautical mile chart that used gridded compass lines for navigation.
### Age of Exploration
Cartography developed further in Europe during the [Age of Exploration](https://www.thoughtco.com/age-of-exploration-1435006) as cartographers, merchants, and explorers created maps showing the new areas of the world that they visited. The cartographers also developed detailed nautical charts and maps that were used for navigation. In the 15th century, Nicholas Germanus invented the Donis map projection with equidistant parallels and meridians that converged toward the poles.
### First Maps of the Americas
In the early 1500s, the first maps of the Americas were produced by the Spanish cartographer and explorer, Juan de la Cosa, who sailed with [Christopher Columbus](https://www.thoughtco.com/christopher-columbus-geography-1434429). In addition to maps of the Americas, he created some of the first maps that showed the Americas together with Africa and Eurasia. In 1527, Diogo Ribeiro, a Portuguese cartographer, designed the first scientific world map called the Pádron Real. This map was important because it very accurately showed the coasts of Central and South America and showed the extent of the Pacific Ocean.
In the mid-1500s, Gerardus Mercator, a Flemish cartographer, invented the Mercator [map projection](https://www.thoughtco.com/types-of-map-projections-4088871). This projection was based on mathematics and was one of the most accurate for worldwide navigation that was available at the time. The [Mercator projection](https://www.thoughtco.com/peters-projection-and-the-mercator-map-4068412) eventually became the most widely used map projection and was a standard taught in cartography.
### Worldwide Maps
Throughout the rest of the 1500s and into the 1600s and 1700s, further European exploration resulted in the creation of maps showing various parts of the world that had not been mapped before. At the same time as the mapped territory expanded, cartographic techniques continued to grow in their accuracy.
## Modern Cartography
Modern cartography began with the advent of a variety of technological advancements. The invention of tools like the compass, telescope, the sextant, quadrant, and printing press all allowed for maps to be made more easily and accurately. New technologies also led to the development of different map projections that more precisely showed the world. For example, in 1772, the Lambert conformal conic was created, and in 1805, the Albers equal area-conic projection was developed. In the 17th and 18th centuries, the United States Geological Survey and the National Geodetic survey used new tools to map trails and to survey government lands.
### Aerial Photographs and Satellite Images
In the 20th century, the use of airplanes to take aerial photographs changed the types of data that could be used to create maps. Satellite imagery has since become a major source of data and is used to show large areas in great detail. Finally, [Geographic Information Systems](https://www.thoughtco.com/what-is-acronym-1689058) (GIS) is a relatively new technology that is changing cartography today because it allows for many different types of maps using various types of data to be easily created and manipulated with computers.
# MAPPING THE WORLD: A SHORT HISTORY OF CARTOGRAPHY
Feb 16, 2021
[https://historyguild.org/mapping-the-world-a-short-history-of-cartography/](https://historyguild.org/mapping-the-world-a-short-history-of-cartography/)
Thousands of years before satellites and GPS, the humble map was used to make sense of the world. These prized possessions allowed humans to navigate, facilitate trade, conquer foreign lands, and shape geographical narratives of power and influence. Behind those maps were history’s greatest cartographers, who developed mathematical methods to advance one of the world’s most important tools. From scrolls to smartphones, the history of cartography provides a timeline of how humans understood the world over the centuries.
#### THE WORLD’S FIRST MAPS
There is no clear winner of the title of world’s earliest map. Some historians argue the first map dates back to 25 000 BCE – a mammoth tusk with markings that some archaeologists believe depict the landscape of the area in which it was discovered. Others have connected rock art paintings in France with constellations, arguing these depictions from 17 000 BCE are the earliest known star maps. But credit for the first surviving map of the ‘entire’ world goes to the [Babylonians](https://historyguild.org/babylonia/).
In 600 BCE, the Babylonians produced a ‘world map’ with Babylon at the centre, surrounded by nearby regions and an expansive ocean. The map is a symbolic representation of how the Babylonians saw the world – not a realistic one – as areas known to the Babylonians at the time were deliberately omitted. Around the same time, several world maps emerged from Greece thanks to major scientific advances, but they were often based on speculation and had no measure of scale.
The true birth of cartography – the study of mapmaking – is commonly credited to Claudius Ptolemy. In his work _Geographia,_ written in the second century CE, Ptolemy revolutionized geography and cartography. He outlined a coordinate system of latitude and longitude for accurate navigation, mapped thousands of areas with their corresponding coordinates, and was the first to use perspective projection to display the globe effectively on a two-dimensional surface.
#### ADVANCES THROUGH THE MIDDLE AGES
Following the [fall of the Roman Empire](https://historyguild.org/christianity-and-the-late-roman-empire/), advances in cartography were largely halted until years later when Muslim scholars and travellers developed the study further. In the 9th century, Abbasid caliph al-Ma’mun commissioned geographers to remeasure the scale and distances used to calculate maps, leading to the first accurate calculation of the circumference of the earth.
In 1154, Geographer Muhammad al-Idrisi produced the _Tabula Rogeriana_ (The Recreation for Him Who Wishes to Travel Through the Countries), the most advanced map of the period. Not only did it depict areas with geographical accuracy, but it also included vast amounts of information about the areas mapped – including cultural and economic information and details about natural features. The map became the standard of cartography for several years and was used by travellers across the region
In Europe, maps were largely made for educational purposes rather than navigation. Known as _Mappae Mundi,_ medieval maps illustrated geographical concepts like direction, the locations of landmasses, and differences in climate. They were also used to tell stories about the world in religious studies, history, and mythology. The maps were often decorated with religious imagery and other drawings, focusing on aesthetic value and storytelling over realism.
Toward the end of the 15th century, increased interest in global exploration, trade, and the expansion of empires necessitated a return to mapmaking for navigational accuracy, spurring the greatest period of advancement in the history of cartography.
#### EARLY MODERN MAPS
During the ‘Age of Exploration’, Iberian travellers and cartographers explored new regions for the first time and gathered information on their journies. In the early 1500s, these expeditions, combined with mathematical principles revived from Ptolemy’s works, gave cartographers the knowledge they needed to produce nautical maps with greater accuracy. Spanish cartographer Juan de la Cosa travelled with Christopher Columbus and produced the first map depicting both North and South America (however, it only contained accurate depictions of the coastlines as inland travel was scarce).
Map of North and South America by Juan de la Cosa, 1500
By 1569, cartographer Gerardus Mercator used the global knowledge gained from the Age of Exploration to produce a map still used today – the Mercator Projection. A skilled mathematician, Mercator used cylindrical projection with straight, parallel lines of latitude and longitude to create his map of the world. By preserving shape but distorting size closer to the poles, the Mercator Projection greatly aided navigation – travellers could draw a straight line to any point on the map and use the direction to plan their journies accurately. Thanks to the projection, travel become simpler and navigators were able to map the interiors of continents, fostering a greater understanding of the world.
#### FROM THE INDUSTRIAL REVOLUTION TO TODAY
During the industrial revolution, the development of maps improved drastically. Mass printing encouraged cartographers to produce smaller maps for use by tourists, focusing on practical value over aesthetic or artistic value. to be constantly updated and adapted to bRapid advances in transportation and new knowledge about the world meant cartography was not a one-time pursuit – maps had e useful.
During the wars of the 20th century, maps became more important than ever in military strategy; so much so that Winston Churchill had a whole Map Room facility constantly in use by the Army, Navy, and Air Force during the Second World War. The Soviet Union’s chief cartographer in 1988 even [admitted the government deliberately falsified maps](https://www.nytimes.com/1988/09/03/world/soviet-aide-admits-maps-were-faked-for-50-years.html) in strategy during the Cold War, moving roads, rivers, and important landmarks.
Tour of the Winston Churchill War Rooms with Taylor Downing
In the late 20th century and now in the 21st century, satellites bring modern technology and cartography together. Computers, GIS (Geographic Information Systems) instruments, and the internet have introduced a new era of accuracy in cartography. More people interact with maps now than ever before, proving they are as essential and valuable now as they were in ancient history.
---
Short summary of the relationship between astronomy and cartography.
**Errors and Discrepancies in Navigation**
The research paper explores the [errors](https://en.wikipedia.org/?curid=41118) and discrepancies in [navigation](https://en.wikipedia.org/?curid=21854) using [stars](https://en.wikipedia.org/?curid=26808) and celestial [navigation](https://en.wikipedia.org/?curid=21854), applying to both the northern and [southern hemisphere](https://en.wikipedia.org/?curid=261273)s. The paper begins by examining conflicting interpretations of [religious texts](https://en.wikipedia.org/?curid=23410414) and follows with a detailed inquiry of several experts and authorities on [navigation](https://en.wikipedia.org/?curid=21854) and [astronomy](https://en.wikipedia.org/?curid=50650). There are numerous examples of [navigation](https://en.wikipedia.org/?curid=21854)al mistakes, including misjudged distances, misplaced land, and wrongly calculated lines of latitude and longitude. The paper indicates that [mariners](https://en.wikipedia.org/?curid=4537683) and [explorers](https://en.wikipedia.org/?curid=72826783) have encountered significant challenges in navigating the [southern hemisphere](https://en.wikipedia.org/?curid=261273) due to the vast unexplored areas, inconsistent charting, and unreliable information. This has led to several [maritime disasters](https://en.wikipedia.org/?curid=46853604) and misadventures, contributing to [skepticism](https://en.wikipedia.org/?curid=26810) and [uncertainty](https://en.wikipedia.org/?curid=63778) in the field of [navigation](https://en.wikipedia.org/?curid=21854). The research paper emphasizes the need for more accurate and reliable information to improve [navigation](https://en.wikipedia.org/?curid=21854) in both hemispheres. [ 3648495158666869 ]
The scientific article addresses various aspects of [navigation](https://en.wikipedia.org/?curid=21854), including [errors](https://en.wikipedia.org/?curid=41118) in present maps, the [skepticism](https://en.wikipedia.org/?curid=26810) surrounding the South Pole, and the challenges related to the prediction of astronomical events such as eclipses. The author critically examines the arguments and evidence presented by globularists and flat earth advocates with a focus on the [navigation](https://en.wikipedia.org/?curid=21854) portion and the use of [stars](https://en.wikipedia.org/?curid=26808) and celestial bodies. [ 128129283749 ]
**Challenges of Navigating Through Polar Regions**
The article discusses the challenges of navigating through the Arctic region, pointing out the [errors](https://en.wikipedia.org/?curid=41118) and lack of correct maps in that area. It also delves into the [skepticism](https://en.wikipedia.org/?curid=26810) and controversies surrounding the exploration of Ant[arctic region](https://en.wikipedia.org/?curid=36971)s and the alleged South Pole discovery. The author questions the validity of the claims made by [explorers](https://en.wikipedia.org/?curid=72826783) and the implications for the accuracy of [navigation](https://en.wikipedia.org/?curid=21854). [ 67 ]
**Astronomical Observations and Theories**
Furthermore, the article discusses observations related to [day and night](https://en.wikipedia.org/?curid=24561447) on Earth, challenging the popular misunderstanding of the problem and the application of certain factors that control the phenomenon. It also addresses the complexities related to the [speed of light](https://en.wikipedia.org/?curid=28736) and how different [theories](https://en.wikipedia.org/?curid=30746) and experiments have led to conflicting opinions about the nature of light and its behavior in celestial space. [ 727374759697 ]
**Conflicting Theories in Gravitational Theory and Celestial Events**
The concept of [gravitational theory](https://en.wikipedia.org/?curid=4387043) and its interpretations by different scientists are also evaluated, with the author highlighting the conflicting opinions and uncertainties among researchers about the existence, cause, origin, and necessity of gravity. The article also delves into astronomical curiosities and contradictions in the predictions of lunar and solar events, showcasing the disagreements among scientists regarding the behavior of celestial bodies. [ 9091 ]
**Controversies in Earth's Geography and Relationship Between Science and Scripture**
The author also sheds light on the complexities surrounding the flow of [rivers](https://en.wikipedia.org/?curid=18842395), especially the Mississippi River, and how the assumptions of a globular or flat earth form lead to contradictory [theories](https://en.wikipedia.org/?curid=30746) about the course and behavior of [rivers](https://en.wikipedia.org/?curid=18842395). This section also encompasses the stance of various clergy members and their conflicting views on the relationship between scripture and science in understanding the shape of the Earth. [ 114117118119 ]
**Critical Evaluation of Navigation Theories**
Overall, the article critically evaluates the diverse viewpoints and evidence related to [navigation](https://en.wikipedia.org/?curid=21854) and the use of [stars](https://en.wikipedia.org/?curid=26808) and celestial heaven, highlighting the conflicting [theories](https://en.wikipedia.org/?curid=30746) and controversies surrounding the topic. [ 125128129158164243499192 ]
**Religious, Scientific, and Historical Aspects of Navigation**
The research paper delves into a detailed investigation of the religious, scientific, and historical aspects related to various authoritative opinions and their implications on the understanding of the cosmos. The paper presents conflicting viewpoints between clergymen and astronomers, particularly focusing on the interpretation of biblical references, such as the use of the term "circle" in the Bible and its correlation with the shape of the Earth. It also discusses the [navigation](https://en.wikipedia.org/?curid=21854)al implications of biblical references, such as Joshua's "Long Day" and the use of celestial bodies for [navigation](https://en.wikipedia.org/?curid=21854). The paper also scrutinizes the accuracy and validity of historical [theories](https://en.wikipedia.org/?curid=30746), including the Copernican-Newtonian system, Laplace's nebular hypothesis, and Darwin's theory of evolution, and underscores their conflicts with religious beliefs. Additionally, it examines the accomplishments of ancient civilizations in comparison to the scientific [theories](https://en.wikipedia.org/?curid=30746) advocated by modern astronomers and scientists. The paper further highlights the tension between religion and science, especially regarding the theory of evolution and the interpretation of Genesis. The research emphasizes the need for critical analysis and reflection rather than adhering to preconceived notions, and urges a deeper examination of the discrepancies in religious and scientific doctrine
## Paper
An Album of Map Porjections (USGS) PDF
[https://upload.wikimedia.org/wikipedia/commons/d/d8/AnAlbumOfMapProjections.pdf](https://upload.wikimedia.org/wikipedia/commons/d/d8/AnAlbumOfMapProjections.pdf)
This project has shifted focus several times throughout its lifetime. At first it was going to be a longitude investigation to determine the origin of longitude. But when i got deeper into that i found so many other connections to other conspiracy webs that i made moves to incorporate the new info into the old structure and at some point it didn't work. It began to incorporate and concentrate on the coordinate system as i started to envision this period as the time they inflicted the spherical coordinates on the word. But then i found the Mercator in 1500 using the globular longitude and knew that timeline needed adjusting. Then i started looking to earlier maps and then i found they ALL used the longitude lines from the globe. Now that i was thoroughly lost confused and a bit dishearten from the all i had hit, i made the connection that brought it all together. The real trick here, was gleaned from the commonalties between the subjects i explored, that is, geodesic surveying, spherical excess and surveying, latitude and longitude, cartography and the historicity of longitude. The common thread between all these subjects slowly became apparent. It was not what i had targeted and pursued, the longitude system that i assumed imported sphericity into our planar earth. But it was very much related.
First i delved into geodesic surveying where i quickly learned they use the stars far more to measure the ground than i ever thought possible. I thought it was strange, but did not totally correlate to what i was focusing on at the time. I did learn they regularly align their measurements of the earth to corresponding measurements in the sky. They regularly applied corrections to their measurements from the alignment of the starts. They also used the transit method to align when they were out in the deep making measurements. Even the first deflection of the vertical took place in 2003/. The first measurement of the deflection he vertical gave them the first Astro geodesic> The combination of the celestial and the geoid points into the deflection of the vertical. From this point on they have been using geodesic surveys to meld these two points together.
Next we can go over the general background knowledge of the events to follow. We are going focus largely on the recently digitizes dump of data from the 1700s and released it to the public int eh museam
Introduction to Making Maps with Computers
An Exploration
Fred W. Pospeschil
[
[email protected]](mailto:
[email protected])
[
[email protected]](mailto:
[email protected])
Background
Back in 1985 I created, and placed in the public domain, the Micro World Data Bank II cartographic data file. This was/is a small sub-set of the full Central Intelligence Agency (CIA) World Data Bank II. Several years later the CIA gave me permission to place the full World Data Bank II, and still later, the Relational World Data Bank II into the public domain. In the following years I was frequently asked if there were any books on how to write programs using the data to make maps. At the time the answer was 'no' A search of the web and book vendors in 2008 revealed that there are a great many books about maps, cartography and Geographic Information Systems (GIS). The search also revealed a considerable amount of open source code for GIS application programs. However, even these many years later, it is difficult, (impossible?) to find any books or sources which explain the basics of getting started in making maps with computers. If you know of any please let me know. Towards the end of this section I have listed some books which relate to map making. None of them really address all that is needed even though they are invaluable references.
As a result of the above, I started this project to share my exploration of various aspects of making maps with computers - and to invite others to contribute what and where they can. I say "explore" because I have never written a map based application from the ground up. All of the map based applications that I have written have used government supplied libraries which handled most of the heavy lifting. I also say "explore" because there appear to be many ways to implement most of the map making functions - each with its own strengths and weaknesses which need to be evaluated. This is, and I expect it will continue to be, a work-in-progress. Any contributions which I make are in the public domain and can be freely used for any purpose. The user is, of course, fully responsible for insuring that the use and/or adaptation of these materials is fully tested to insure that they meet their needs and expectations.
Before going any farther I want to make it clear that this effort is focused on simply making maps and not on building Geographic Information Systems (GIS) applications. If you are interested in GIS there are a large number of sites devoted to that subject. A good starting point would be the Open geospatial Consortium whose page states that "The Open Geospatial Consortium, Inc.® (OGC) is a non-profit, international, voluntary consensus standards organization that is leading the development of standards for geospatial and location based services." You can reach them at [www.opengeospatial.org](http://www.opengeospatial.org/)
```
If you are looking for GIS applications I would recommend you search the web for some of the following terms: Fulcrum, G_Projector, GeoAPI, Geocart, GeospatialMethods, GeoTools, geotrans, GeoViz, GisToolKit, GML, GMT, GPSylon, Java Map Projection Library, Java Script Projection Library, JCT, JTS Topology Suite, MapBuilder, MapEditor, mapimg2_source.tar, Mapnik, MapWindow, MicroCam, MyMaps, NASA World Wind, Open Jump, OpenMap, Panoply, Proj4, Proj4J, QGIS, SkyJump, and UDig. Unfortunatley, over time, some of these may disappear.
My initial approach to learning how to write mapping programs was to look into the various open source GIS programs which are listed above. I found that GIS programs normally have a lot of capabilities that are not needed to simply make basic maps. In addition, they frequently do not have many of the features needed by basic map making programs. Thus, trying to re-write one of the available open source GIS programs to simply make maps did not appear to be a cost effective approach.
Most of the open source GIS program code is fairly advanced and highly object oriented and written in some dialect of Java, C or BASIC. Since I was not fluent in these languages it was difficult and time consuming to try to extract specific capabilities - providing I could find them. Because the OGC chose Java for their implementation language, most of the open source GIS's seem to be written in that language. Thus, I decided to leave my previous languages (C, Pascal and Ada) and learn Java for this project. Also towards the end of this section is a list of Java books which I have in my library - in case you want to point me to something in one of them.
```
Environment
Since I knew that I was going to need some map projection code, and I did not want to re-invent that wheel, I began my efforts by looking for projection code in the open source GIS's. I was amazed at how widely the Object Orientated Programming (OOP) syntax varied between the languages and how differently programmers decided to design their projection objects. As one looks back, in my case to the mid 1960s, it is interesting to reflect on all of the languages, techniques, methodologies, and silver bullets which have come and gone and now litter the historical programming landscape. While OOP and Java are currently in vogue, it is possible to envision a time when they may change or also fade into obscurity. As a result, my efforts have shifted from trying to write a map making program in Java to learning and describing how to do it in English. Java will be uses as a tool to verify the validity of approaches, concepts, formulas, etc. What I would like to see is an effort where interested people could discuss the subject in a semi-programming-language-independent way and use multiple programming languages to test, verify and illustrate the topic under discussion. Unfortunately, regardless of the language selected it will color and influence the detailed discussions.
Therefore, in order to be understandable by the greatest number of programmers, Java's basic OOP approaches and syntax will be used when necessary and, otherwise be avoided or minimized. Thus, the important parts of the code may be written in essentially old fashioned procedural code with an eye towards putting it in an OOP environment at some other time. If we understand what needs to be done, and how to go about getting it done, we should then be in a better position to implement the desired capabilities in any current or future language or methodology. I have generally used JavaDoc even though it appears to be little used outside of the Java environment. To support non-Java programmers, I have also written much of the program documentation using more traditional approaches. Suggestions for improvement are welcome.
I looked at three Integrated Development Environments (IDEs) for this effort - NetBeans, Eclipse and JBuilder 2006 - that order. While I liked Eclipse better than NetBeans, the 'Eclipse' way of doing things seemed to get between me and the real problem I wanted to work on. Since the free IDEs did not do the job I purchased a copy of JBuilder 2006. This was the last version which was not basically a front end to Eclipse With the passage of time new tools became available. After some review and testing, in 2013 the project was converted to using the InteliJ IDEA IDE and JFormDeveloper for GUI development. Java 6 was the current release at the beginning of this phase.
Overall Approach
Since I have no idea about how long it will take to complete this project I have decided to release, or add, "parts" as they are completed or I can't take the subject area any further. The remainder of this section is divided into two sections - Supporting Projects and a list of web links and books which I have found useful.
Please note that each of these "parts" is a complete stand-alone project or package. When the part contains a program it will contain all of the directories and files which were used in developing the part/program. When one part needs something from another part that 'something' is copied into the project so you will have everything that is needed. These "parts" are combined into the AllOfMakingMaps.zip file.
The SourceForge files download page which contains this file also contains a Reference Documents.zip file. That file contains a number of basic and introductory documents relating to cartography and maps. The web has an unending supply of pages devoted to maps, cartography and related matters. All to often, the pages are moved, or worse, deleted. This can lead to valuable sources disappearing. The purpose of this .zip file is to make sure that these files are always available to you.
The .zip file also contains several more advanced documents which relate toWGS84. This is the cartographic reference system used by the Global Positioning System (GPS). More and more, coordinates based on this referencing system are becoming the standard. In addition, WGS84 is the referencing system used by your hand-held or car/boat GPS. The Micro World Data Bank II and all CIA World Data Bank coordinates are based on WGS84. If you select all of your cartographic data based on WGS84 you will not have to worry about data from various sources not working together. That is because WGS84 covers the whole earth.
As the project progresses additional documents and programs will be added to the AllOfMakingMaps.zip file. To assist you in figuring out which files to look at first a three digit numeric prefix for each file or directory. As you probably noticed, this document starts with "000" as it is the first one you need to look at. Subsequent documents will have sequence numbers which are incremented by 010. This will allow for still later documents to be slipped in between previous documents.
```
I would like this effort to turn the question "how are maps made with computers" into something that tells us "how maps are made with computers". Any suggestions and inputs you might be able to provide will be greatly appreciated and full credit will be given.
```
Supporting Projects
```
Will Java handle the load? Since map making can be math intensive the first thing I did was to write a Java program (my first) which would take a quick look at how fast Java can do some basic iterative operations. The bottom line is that I was quite satisfied with the performance on a number of different platforms. Go to the very end of this document for a overview of the tests and the results obtained on a number of machines
Map projection Code Development Library. I began looking for map projection code in the various open source GISs. Overall, they offered only a very limited selection and there didn't seem to be consistent in their OOP approach. Trying to merge or convert the various approaches appeared to be more than I able to do or wanted to tackle After an extended period of looking through the GISs I happened across the Java Map Projection Library by Jerry Huxtable - www.jhlabs.com/java/maps/proj/index.html . This is a port of some eighty projections, many with inverse projections, of the C language Proj4 library. Unfortunately, it is an undocumented work-in-progress upon which all work has been terminated. Because Jerry allowed me to look at the application code for his Globe program, which runs in a window at the bottom of the above referenced URL, I was able figure out how the code could be used. I then wrote a program to test the routines in the library (class). Since I had no idea of exactly what needed to be done to test the code, the program simply evolved as I figured out one detail after another. Along with the program I wrote a 55 page programmer's manual in which I tried to document the 'what' and 'how' of using the library. Where I could, I developed fixes for some of the errors in the converted code. This exercise clearly illustrated how difficult it can be, at least for me, to translate or convert OOP code between languages. The manual and program documentation describe what works and what doesn't work. The code contains Jerry's and my notes and comments on what seems to still need work. If you want to look into fixing some of the projections click here (2.7 MB). This zip file contains the modified projection source code, the executable test program jar file, code and documentation for the program, a small cartographic data set and the programmer's manual.
This is the user interface for the programs which test the development and production versions of the map projection library.
Map projection Code Production Library. Since most programmers will probably not be interested in digging through all of the projection code and associated notes and comments, I built a subset of the development package which contains only that code and associated programs and documentation which appear to work correctly. This version contains some seventy forward and 26 inverse projections, a revised test/demo program with code, and 42 page programmer's manual. As with the test program mentioned above, the only purpose of the program is to test and illustrate the use of the projection code. Thus, it is an example of how not to use Java - but it does test the projection code. To down load a copy of this version of the library and associated files click on JMPL.zip (2.3 MB).
```
Basic cartographic data. In addition to map projection routines one also needs some cartographic data. The MWDB Formatter Program allows the user to customize the Micro World Data Bank II data to meet various needs and satisfies requests which have been made over the years. This is an updated version of my original 1984 dataset and now contains some 219,689 points. Charles Culberson performed numerous corrections and expansions during 1993-2007. The original data was in Intel little endian format which is used by most PCs. Big endian data is used by most Unix computers and earlier MACs. More recent MACs are using Intel type CPUs and, thus, will use little endian data. Please note that Java programs normally use big endian data regardless of what type of computer they are running on. With some special coding, Java programs can also read and use little endian data. This program illustrates how to work with both big and little endian data.
This program allows the selection of any or all of the available features to be output in either little or big endian as well as text formats. The features include: coastlines, islands, lakes, rivers, and state/provincial boundaries for the United States, Canada, Mexico, Australia, and a few others. Paul B. Anderson's MWDB Polygon data is also included in this package. This polygon data supports filling areas such as countries with colors and patterns. Click here to download this package (2.8 MB).
Icons GIFs & PNGs When writing programs is handy to have a good supply of icons for use on your tool bars and for similar uses. While looking into a large number of open source GIS and other types of programs I found that they often provided a number of very usable icons. These were collected and sorted into directories based on the size of the icon. The icons in this collection range in size of 9x9 to 64x64 pixels. A small number are animated. All total, there are some 27 directories containing 886 icons. 2.13 MB when un-zipped. Click here for the icons.
Utilities. Any Graphical User Interface (GUI) program requires a variety of general utility capabilities which have little or nothing to do with maps. The fwpUtil library/package provides a variety of Java general utility classes and dialogs focused mainly on general and graphics applications. In addition to the library, a test and demonstration program is provided. This program calls/exercises all of the classes in the library as well as demonstrates the use of the eight JOptionPane methods. Full source code is provided. In addition to the standard JavaDoc files there is an additional Documentation directory in the fwpUtil directory which contains easier to use documentation with screen shots.
The package contains the following classes and dialogs - ColorChooser, FontChooser, FontColorChooser, GetRenderingHints, TextViewer, HTMLViewer, LineAndColorChooser, and a program activity logging capability. The utilities library can be obtained by clicking here (3.3 MB).
# Height map
.jpg)
The next section, "010 The Coordinate Transformation Pipeline" will provide an overview of the process by which geographical coordinates are transformed and manipulated to generate a map image which can be displayed or printed.
Recommended Web Links
Paul B. Anderson’s Map Projection Site [http://www.csiss.org/map-projections/index.html](http://www.csiss.org/map-projections/index.html)
PROJ.4 - Cartographic Projections Library [http://trac.osgeo.org:80/proj/](http://trac.osgeo.org/proj/)
User’s manuals for PROJ by Gerald Evenden
ftp://ftp.remotesensing.org/proj/OF90-284.pdf
ftp://ftp.remotesensing.org/proj/proj.4.3.pdf
ftp://ftp.remotesensing.org/proj/proj.4.3.I2.pdf
GeoTIFF site with information on how to describe many common projections with PROJ.4 command arguments [http://www.remotesensing.org/geotiff/proj_list/](http://www.remotesensing.org/geotiff/proj_list/)
An introduction to cartography emphasizing map projections: their properties, applications and basic mathematics. [http://www.progonos.com/furuti/MapProj/CartIndex/cartIndex.html](http://www.progonos.com/furuti/MapProj/CartIndex/cartIndex.html)
An overview of:
Universal Transverse Mercator (UTM) and Universal Polar Stereographic (UPS)
Military Grid Reference System (MGRS)
United States National Grid (USNG)
Global Area Reference System (GARS)
World Geographic Reference System (GEOREF)
[http://earth-info.nga.mil/GandG/coordsys/grids/referencesys.html](http://earth-info.nga.mil/GandG/coordsys/grids/referencesys.html)
FreeGIS.org [http://www.freegis.org/](http://www.freegis.org/)
geodata.gov [http://gos2.geodata.gov/wps/portal/gos](http://gos2.geodata.gov/wps/portal/gos)
Geodetic Datums [http://www.colorado.edu/geography/gcraft/notes/datum/datum_f.html](http://www.colorado.edu/geography/gcraft/notes/datum/datum_f.html)
Open Jump [http://openjump.org/](http://openjump.org/)
Map Projection Home Page [http://www.geography.hunter.cuny.edu/mp/](http://www.geography.hunter.cuny.edu/mp/)
National Atlas Home Page [http://www.geography.hunter.cuny.edu/mp/](http://www.geography.hunter.cuny.edu/mp/)
Open Source GIS [http://opensourcegis.org/](http://opensourcegis.org/)
Open Layers [http://openlayers.org/](http://openlayers.org/)
USGS National Map [http://nationalmap.gov/](http://nationalmap.gov/)
GeoTools [http://docs.codehaus.org/display/GEOTDOC/Home](http://docs.codehaus.org/display/GEOTDOC/Home)
Geospatialmethod.org [http://geospatialmethods.com/about.html](http://geospatialmethods.com/about.html)
Map Projections [http://members.shaw.ca/quadibloc/maps/mapint.htm](http://members.shaw.ca/quadibloc/maps/mapint.htm)
WolframMathWorld Map Projections [http://mathworld.wolfram.com/topics/MapProjections.html](http://mathworld.wolfram.com/topics/MapProjections.html)
Map Related Books
(Allan 2004) Arthur L. Allen, Maths for Map Makers, (Whittles Publishing, Dunbeath Mill, Scotland 2004)
(Brewer 2005) - Cynthia A. Brewer, Designing better MAPS A Guide for GIS Users, (Redlands California, ESRI Press 2005)
(Carter 1984) - James R, Carter - Computer Mapping, Progress in the 80's, (Washington DC, Association of American Geographers, 1984)
(Clarke 1995) - Keith C. Clarke, Analytical and Computer Cartography, (Englewood Cliffs, NJ, Prentice Hall, 1995)
(Cromley 1992) Robert G. Cromley, Digital Cartography, (Englewood Cliffs, NJ, Prentice Hall, 1992)
(DMA 1984) - Geodesy for the Layman, DMA Technical Report 80-003 (Washington DC, Defense Mapping Agency 1984)
(Gilbert 1997) - Stephen Gilbert and Bill McCarty, Object-Orientated Programming in Java, (Corte Madera, CA, Waite Group Press, 1997)
(Gilbert 1998) - Stephen Gilbert and Bill McCarty, Object-Orientated Design in Java, (Corte Madera, CA, Waite Group Press, 1998)
(Hooijberg 1997)Maarten Hoolijberg, Practical Geodesy Using Computers, (Springer-Verlag, Berlin Heidelberg 1997)
(Iliffe & Lott 2008) Jonathan Iliffe and Roger Lott, Datums and Map Projections, (Whittles Publishing, Dunbeath Mill, Scotland 2008)
(Johnson 1979) - William D. Johnson, Computer Generated Maps, (Byte Magazine, May & June 1979)
(Krygier 2005) - John Krygier and Denis Wood, Making Maps - a Visual Guide to Map Design for GIS, (New York, NY, The Guilford Press 2005)
(Lambert 1772, Tobler 1972) J. H. Lambert, Notes and Comments on the Composition of Terrestrial and Celestial Maps, translated by Waldo R. Tobler, (Esri Press, Redlands CA 2011)
(Makower 1986) - Joel Makower, The Map Catalog, (New York, NY, Vintage Books, 1986)
(Miller 1987) - Robert Miller and Francis Reddy, Mapping the World in Pascal, (Byte Magazine, Dec 1987)
(Monmonier 1982) - Mark S. Monmonier, Computer Assisted Cartography Principles and Prospects, (Englewood Cliffs, NJ, Prentice Hall, 1982)
(Newton 1985) G. D. newton, Computer Programs for Common Map Projections, (Washington D.C, USGS Bulletin 1518, 1985)
(Pearson 1990) - Frederick Pearson, II, Map Projections: Theory and Applications, (Boca Raton, FL, CRC Press, 1990)
(Robinson 1984) - Arthur H. Robinson, et all, Elements of Cartography, Fifth Edition, (New York, NY, John Wiley & Sons 1984)
(Snyder 1981) - John P. Snyder, Space Oblique Mercator Projection Mathematical Development, (Washington D.C, USGS Bulletin 1518, 1981)
(Snyder 1984) - John P. Snyder, Map Projections Used by the U.S. Geological Survey, , (Washington D.C, Geological Survey Bulletin 1532, 1981)
(Snyder 1987) - John P. Snyder, Map Projections, A Working Manual, USGS Professional Paper 1395 ( USGPO 1987)
(Snyder1 1987) John P. Snyder, Map Projections Used for Large-Scale Quadrangles by the U.S. Geological Survey, (Washington D.C, USGS Ciccular 982, 1987)
(Snyder 1989) - John P. Snyder and Philip M. Voxland, An Album of Map Projections, USGS Professional Paper 1453 (USGPO 1989)
(Snyder 1993) - John P. Snyder, Flattening the Earth, Two Thousand Years of Map Projections, (Chicago, IL, The University of Chicago Press, 1993)
(Thompson 1988) - Morris M. Thompson, Maps for America, (USGS, USGPO 1988)
(Wilford 1981) - John N. Wilford, The Mapmakers, (New York NY, Alfred A. Knopf, 1981)
Java Books
(Bloch 2001) - Joshua Bloch, Effective Java, Programming Language Guide, (Palo Alto, CA, Sun Microsystems, Inc., 2001)
(Boudreau 2003) – Tim Boudreau and others., NetBeans - The Definitive Guide, (Sebastopol, CA, O’Reilly & Associates, Inc., 2003)
(Burd 2007) - Chet Haase and Romain Guy, Filthy Rich Clients, (Hoboken, NJ, Wiley Publishing Inc., 2007)
(Burnette 2005) - ed Burnette, Eclipse IDE Pocket Guide, (Sebastopol, CA, O’Reilly Media, Inc., 2005)
(Campesato 2002) - Oswald Campesato, Java Programming Library: Concepts to Source Code, (Hingham, MA, Charles River Media, Inc, 2002)
(Coad 1999) - Peter Coad, Mark Mayfield and Jon Kern, Java Design, (Upper Saddle River, NJ, Yourdon Press, 1999)
(Eckstein 1998) - Robert Eckstein et al., Java Swing, (Sebastopol, CA, O’Reilly & Associates, Inc., 1998)
(Darwin 2004) - Ian F. Darwin, Java Cookbook, (Sebastopol, CA, O’Reilly Media, Inc., 2004)
(Deitel 2005) – H. M. Detiel and P. J. Detiel, Java How to Program, (Upper Saddle River, NJ, Prentice Hall, 2005)
(Flanagan 2004) - David Flanagan., Java Examples In a Nutshell, (Sebastopol, CA, O’Reilly Media, Inc., 2004)
(Flanagan 2005) - David Flanagan., Java In a Nutshell, (Sebastopol, CA, O’Reilly Media, Inc., 2005)
(Geary 1999) - David M. Geary, Graphic Java – Mastering the JFC 3rd ed. Vol II SWING, (Palo Alto, CA, Sun Microsystems, Inc., 1999)
(Geary 1999-1) - David M. Geary, Graphic Java – Mastering the JFC 3rd ed. Vol I AWT, (Palo Alto, CA, Sun Microsystems, Inc., 1999)
(Gilbert ) - Stephen Gilbert and Bill McCarty, Object Oriented Design in Java,
(Hardy 2000) – Vincent J. Hardy, Java 2D API Graphics, (Palo Alto, CA, Sun Microsystems, Inc., 2000)
(Harold 1999) - Elliotte Rusty Harold, Java I/O, (Sebastopol, CA, O’Reilly & Associates, Inc., 1999)
(Haase 2008) - Guy Haase and Romain Guy, Filthy Rich Clients, (Palo Alto, CA, Sun Microsystems, Inc., 2008)
(Horstmann 1999) - Cay S. Horstmann and Gary Cornell, Core JAVA Vol I - Fundamentals, (Palo Alto, CA, Sun Microsystems, Inc., 1999)
(Horstmann 1999) - Cay S. Horstmann and Gary Cornell, Core JAVA Vol I - Fundamentals, (Palo Alto, CA, Sun Microsystems, Inc., 1999)
(Horstmann 2006) - Cay S. Horstmann and Gary Cornell, Core JAVA Vol II – Advanced Features, (Palo Alto, CA, Sun Microsystems, Inc., 2006)
(Jordan 2003) – David Jordan and Craig Russell, Java Data Objects, (Palo Alto, CA, Sun Microsystems, Inc., 2003)
(Klawonn 2008) Frank Klawonn, Introduction to Computer Graphics, (Springer - Verlag, London, 2008)
(Knudsen 1999) - Jonathan Knudsen., Java 2D Graphics, (Sebastopol, CA, O’Reilly & Associates, Inc., 1999)
(Lafore 2003) - Robert Lafore, Data Structures & Algorithms in Java, (Indianapolis, IN, SAMS, 2003)
(Lemay 1999) – Laura Lemay and Rogers Cadenhead, SAMS Teach Yourself Java 2, (Indianapolis, IN, SAMS, 1999)
(Liang 2002) – Y. Daniel Liang, Introduction to Java Programming with JBuilder 4/5/6,(Upper Saddle River, NJ, Prentice Hall, 2002)
(Ligouri 2008) - Robert & Patricia Liguori, Java Pocket Guide, (Sebastopol, CA, O’Reilly Media, Inc., 2008)
(Lowe 2007) - Doug Lowe and Barry Burd, Java All-In-One Desk Reference for Dummies (Indianapolis, IN, Wiley Publishing Inc., 2007)
(Loy 2003) - Mark Loy et al., Java Swing (Sebastopol, CA, O’Reilly Media, Inc., 2003)
(Matthews 2003) – Mark Matthews, Jome Cole, Joseph Gradecki, MySQL and Java Developer’s Guide, (Indianapolis, IN, Wiley Publishing Inc., 2003)
(Marinacci 2005) - Joshua Marinacci & Chris Adamson, Swing Hacks, (Sebastopol, CA, O’Reilly Media, Inc., 2005)
(Niemeyer 2002) - Patrick Niemeyer and Jonathan Knudsen., Learning Java, (Sebastopol, CA, O’Reilly Media, Inc., 2002)
(Pantham 2000) - Satyaraj Pantham, JFC 2D Graphics and Imaging (Indianapolis, IN, SAMS, 2000)
(Robinson 2003) - Matthew Robinson and Pavel Vorobiev, Swing, (Greeenwich, CT, Manning Publications Co., 2003)
(Stevens 1999) - Roger T. Stevens, Graphics Programming With Java 2nd ed, (Rockland, MA, Charles River Media, Inc., 1999)
(Sierra 2005) - Kathy Sierra and Bert Bates, Head First Java, (Sebastopol, CA, O’Reilly Media, Inc., Inc., 2005)
(Topley 2000) - Kim Topley, Core SWING advanced programming, (Upper Saddle River, NJ, Prentice Hall PTR, 2008)
(Wall ) - David Wall, Graphics Programming With JFC, ()
Links to this page
[69 Miles Per Degree](https://publish.obsidian.md/shanesql/69+Miles+Per+Degree)
[Coordinate Systems](https://publish.obsidian.md/shanesql/Coordinate+Systems)
[G Projector Map Software](https://publish.obsidian.md/shanesql/G+Projector+Map+Software)
[Geodesic Surveying, Spherical Excess](https://publish.obsidian.md/shanesql/Geodesic+Surveying%2C+Spherical+Excess)
[The Celestial Sphere](https://publish.obsidian.md/shanesql/The+Celestial+Sphere)